Showing posts with label Divergence. Show all posts

Tuesday, July 5, 2011

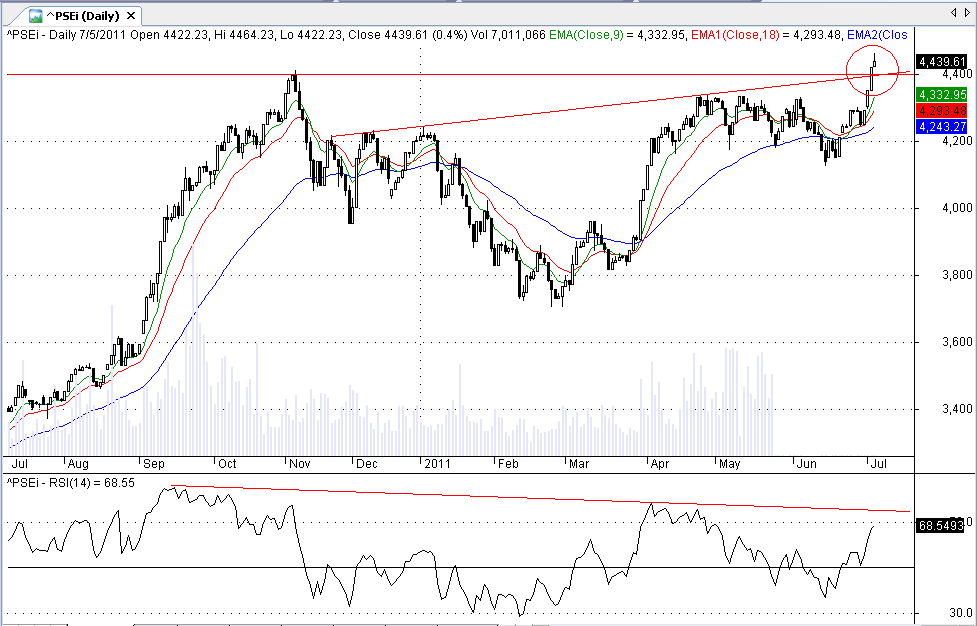
PSEi: Heading towards new highs?


Obvious bearish divergence. If divergence is still present after 3 pushes to its high, take profits.
I am expecting a short term correction after breaking out of:

1) previous resistance - 4413
2)inverted head and shoulder pattern - target: 5095 (695 points); however, the pattern is too big to be deemed accurate so the index would either fall short or overshoot the target;
bulls are hoping to overshoot the target so everybody would be happy.

Breakout seems legit as the accompanying volume is exceptionally high(7+Bil TO) today
As for the short term correction, I am hoping for a shallow one so there would be more steam for the next leg.

Index weekly:

Tuesday, June 21, 2011

TEL: Divergence

Divergence: Deal or no deal?


The only thing that disturbs me with TEL is the flat price action in between divergences, inclining me to believe this action as a fake one.


Tuesday, June 14, 2011

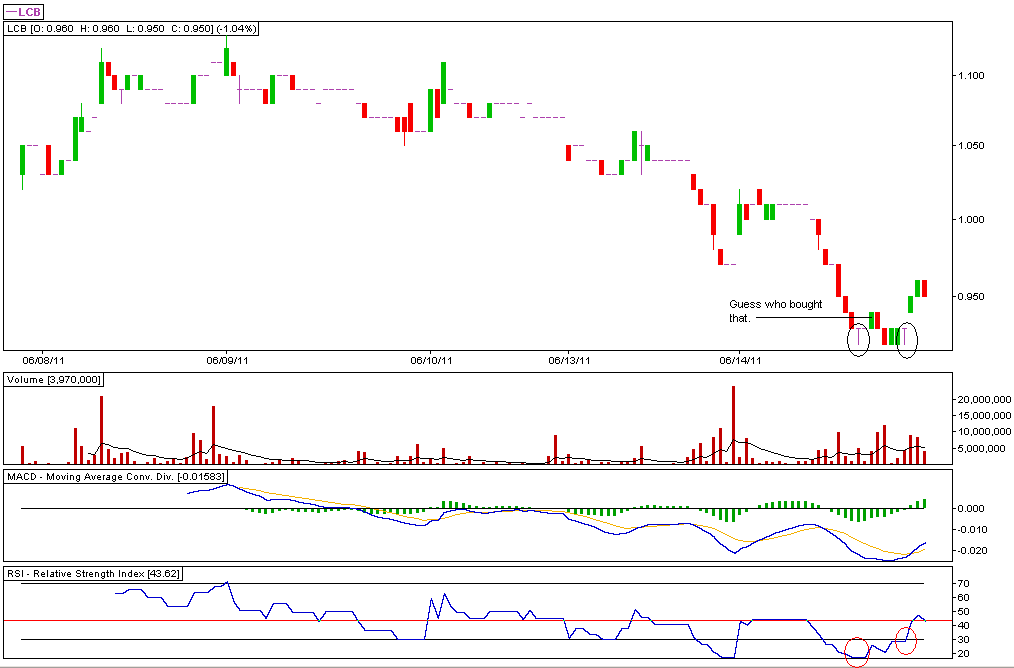
LCB

Divergence on the 5-minute chart


I chose LCB over LC because it is lighter.
LC bounced off MPP.

Let's see if this move is sustainable throughout the week.

LC

Divergence confirmed?

Thursday, June 9, 2011

LC

Bullish divergence is confirmed once price advances tomorrow.

PX

Bullish divergence is confirmed once price advances tomorrow.

Tuesday, June 7, 2011

GERI

Just another case of bearish/bullish RSI divergence on the 5-minute chart

LC

Bullish divergence on the 5-minute chart


Since the last bearish divergence produced a 10% drop, I am going to assume that this bullish divergence will produce a 10% gain(at most) with an average of 4.5% gain for the mean time.

Monday, June 6, 2011

Friday, June 3, 2011

Breakout! - Not!

LC daily chart:


RSI is the give away here. But with LCB:


RSI looks pretty strong as it broke past 70!
Volume is very good too!

WHY?????!!! /wrist


*On a personal note, weekly charts appears to be bullish.

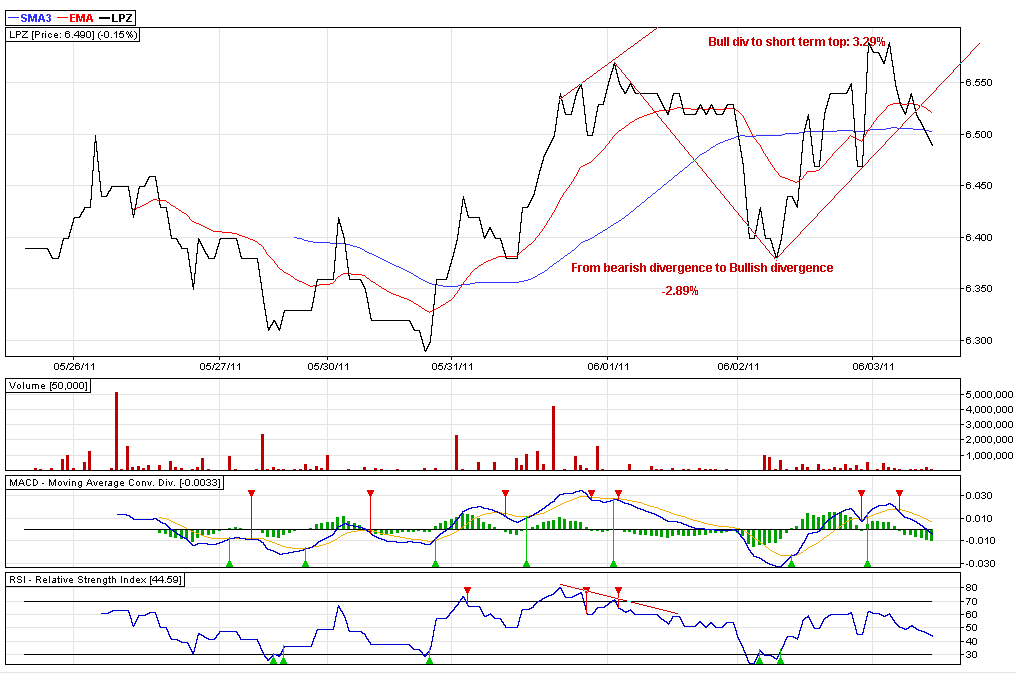
LPZ

5-minute chart: Bearish divergence - bullish divergence:

LC: Bearish divergence on 5-min chart

Will you drop?

LC

So I asked around the local "trading" forum about how many points does a bearish divergence found in 5/10 min chart costs. So far, nobody has replied yet. It appears like there are less people trading using intraday charts.

I'll just make my own research then.

LC 5-min chart:


How low will you go?