Showing posts with label PSEi. Show all posts

Saturday, July 9, 2011

PSEi

The index pulled right back after reaching its secondary monthly resistance(2) after breaching the monthly pivot point(1) which was also confirmed by the RSI bouncing-off(3) the 50 level.


For the upcoming week, the index needs to close higher than 4400 to continue the upswing with 4500(4514) as a potential target/resistance. Anything higher than that could mean a steep climb, with RSI confirming hopefully, and 4500 could turn into the new support.

However, failure to break past 4400 could ruin the bullish sentiment and the index would probably land at 4300(4290) this week.

Index level is also bearishly divergent to previous high(lower RSI from previous high).

Trend strength appears to be relatively weak as suggested by the DMI reading(not picking up).

Tuesday, July 5, 2011

PSEi: Heading towards new highs?


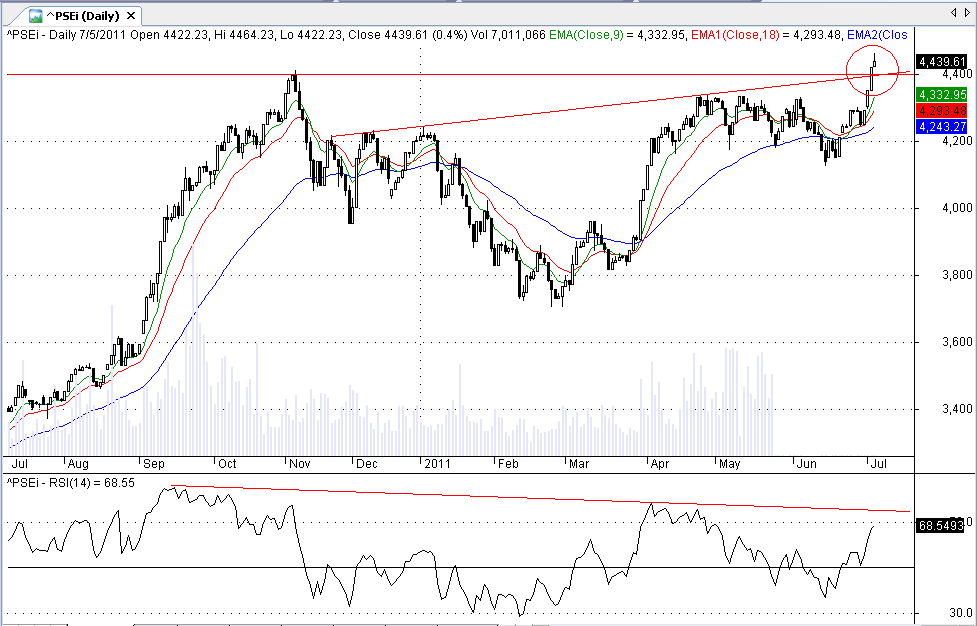
Obvious bearish divergence. If divergence is still present after 3 pushes to its high, take profits.
I am expecting a short term correction after breaking out of:

1) previous resistance - 4413
2)inverted head and shoulder pattern - target: 5095 (695 points); however, the pattern is too big to be deemed accurate so the index would either fall short or overshoot the target;
bulls are hoping to overshoot the target so everybody would be happy.

Breakout seems legit as the accompanying volume is exceptionally high(7+Bil TO) today
As for the short term correction, I am hoping for a shallow one so there would be more steam for the next leg.

Index weekly:

Wednesday, February 16, 2011

Philippine Stock Exchange (PCOMP)


Looks like that the Index is poised to resume its downtrend in the short term.

Major resistance at 4000.

Monday, February 14, 2011

Philippine Stock Exchange Index (PCOMP)


Accelerated downtrend.

Signs of reversal:

1. Formation of higher peak and trough.
2. Steep decline on heavy volume.

The steep decline on heavy volume would be the "blast to put the fire out". A parabolic drop so to speak - the sign of capitulation.

Thursday, February 10, 2011

Philippine Stock Exchange Index (PCOMP)


RSI just went into oversold territory. The only problem now is how long will it stay oversold and how deep do we go before we have that dead cat bounce.

Monday, January 24, 2011

PSEi: Doomsday scenario

As the moons of Mars and Earth align, just kidding.

Possible scenario for PSEi if it completely breaks down from support:


Sunday, January 16, 2011

Philippine Stock Exchange (PCOMP)


Looks like the market is poised to move sideways for the meantime after sliding down big time (as pointed out by the bearish rsi/price divergence) from the recent top at 4400 levels. However, the index seems to be moving higher this coming week as suggested by the strong closing last Friday with RSI seeking to break above 50.

Volume indicators reflect moderate flows of volume into the index indicates mild bullishness in the short to medium term.

Short to medium trend: Sideways to up.
Support: 4000 levels
Resistance: 4300 levels

Breaking and holding up above 4300 levels would suggest the resumption of the uptrend.

Tuesday, January 11, 2011

Philippine Stock Exchange Index (PCOMP)

PSEi 10-Year Daily Chart


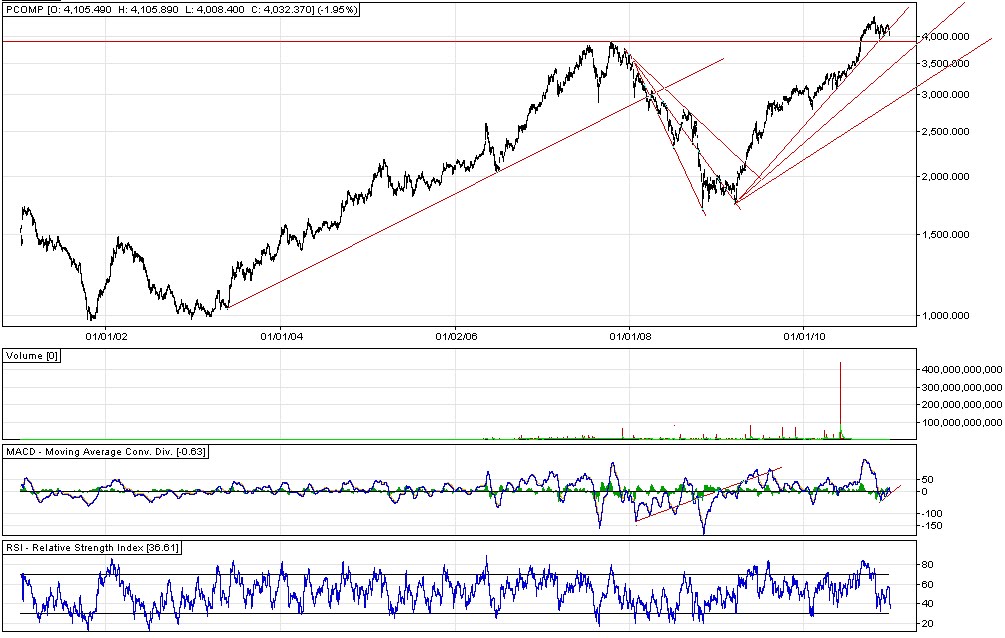
The PSEi broke its major support line today. Is this the beginning of the end? It would seem not as the MACD are forming several rising troughs. The breaking of the said trendline only suggests that the market is slowing down to a more sustainable trend. With this being said, the market would simply move sideways for the meantime before heading back up again.

Breaking the secondary trendline would suggest further slowdown of the market.

Breaking down from the major support at 3870 levels would only suggest a deep correction(very deep in fact as it is pointing to 3500-3600 levels if it is an accelerated decline).

Market Condition: Sideways to down.

Tuesday, October 5, 2010

Philippine Stock Exchange Index (PCOMP)

Ten-Year Daily Chart PSEi


The previous advance from 3600 level was succeeded by continuous 1% gain on a daily average, breaking the previous high at 3896, before meeting slight resistance at the psychological resistance at 4000 which caused choppy movements in the recent advances. The breaking of the 4000 psychological resistance by 3% suggests that the current uptrend is still good and it is simply resting before heading back up.

Current MACD reading is suggesting that the recent high is currently at the peak of the uptrend as it has relatively the same MACD reading as the previous high at 3896 which is also confirmed by the current DMI reading.

The fast MACD line has crossed below the slower MACD line suggesting that there would be a consolidation in the short to medium term. Chances of making a combination of correction-consolidation is relatively average, possibly a retest of the now current psychological support at 4000 before heading back up.

There is a Momentum-Rate of Change to Price divergence, further confirmed the short to medium term consolidation being suggested by the MACD and DMI readings.

The market is now trying to break into the old support line (current resistance).

Support (Fibonacci Retracements): 4055 - 3943 - 3864
Psychological Support: 4000 - 3896