
Showing posts with label NIKL. Show all posts
Showing posts with label NIKL. Show all posts
Thursday, June 2, 2011

Thursday, February 17, 2011
London Metal Exchange: Nickel

Too bad that I could only get historical data starting from January 1.
Volume on the chart is the volume of supply for that day (in tonnes).
Wednesday, February 16, 2011
Nickel: Opening stocks(tonne) and Price - Updated daily
Opening stock(tonne) and Price:
Date-opening stock-price:
Since the peak of supply last January at 137766, supply has started to decline up to date. Supply has dropped by 5% since then, driving the price of nickel higher by 11.20%.
Supply and demand baby, Econ1. My college prof would be proud! :)
If I get lucky, I could probably make a line graph with this data in Metastock.
It's a shame though because I could only access data from the beginning of the year.
Filed under NIKL.
Date-opening stock-price:
FEBRUARY 2011
18
17 129924 28295.00
16 130248 28550.00
15 130248 28895.00
14 130422 28670.00
11 131112 27830.00
10 131898 28005.00
09 132330 28255.00
08 132936 27850.00
07 132828 28700.00
04 132798 28070.00
03 133500 27775.00
02 134172 27710.00
01 134442 27650.00
JANUARY 2011
31 134040 27070.00
28 134298 26820.00
27 135186 26795.00
26 134862 26150.00
25 134958 25750.00
24 135174 26265.00
21 130248 25850.00
20 137124 25645.00
19 137238 26190.00
18 137352 26355.00
17 137766 25985.00
14 136302 25460.00
13 136662 25720.00
12 135096 25060.00
11 135864 24590.00
10 136806 24045.00
07 136896 24340.00
06 137040 24870.00
05 136860 24640.00
04 136890 25170.00
Monthly Average: 25638.50
Since the peak of supply last January at 137766, supply has started to decline up to date. Supply has dropped by 5% since then, driving the price of nickel higher by 11.20%.
Supply and demand baby, Econ1. My college prof would be proud! :)
If I get lucky, I could probably make a line graph with this data in Metastock.
It's a shame though because I could only access data from the beginning of the year.
Filed under NIKL.
London Metal Exchange: Nickel
I probably should also monitor the supply of nickel stock daily to monitor whether the supply is increasing/decreasing. Had to dig a little deeper to find the info though. Daily price update first:

CASH BUYER 28,895.00
CASH SELLER & SETTLEMENT 28,900.00

CASH BUYER 28,895.00
CASH SELLER & SETTLEMENT 28,900.00
Tuesday, February 15, 2011
London Metal Exchange: Nickel

Inverted head and shoulder pattern: 28500 (done - 28700)
Bullish flag/pennant: 31700 (rough estimate - $14.37/lb)
Possible upside at current price: 13.90%
Short to medium crazy nickel forecast: $16/lb
Nickel chart is filed under Nickel Asia(NIKL) chart.
CASH BUYER 28,670.00
CASH SELLER & SETTLEMENT 28,680.00
Looking way back into the bigger picture:

Just broke out of the bigger inverted head and shoulder. Judge it for yourself.
It seems to me that the demand for the metal is growing though.
Monday, February 14, 2011
London Metal Exchange: Nickel
CASH BUYER 27,830.00
CASH SELLER & SETTLEMENT 27,835.00
Down by 1.5% from last Thursday.
From the beginning of the year(01/01/11 - $12.62/lb), Nickel prices has risen by 10.50% up to date(02/14/11 - $12.62/lb) with a high of $13/lb last February 8.
Thursday, February 10, 2011
Nickel Asia Corporation (NIKL)

Following the trend.
London Metal Exchange: Nickel

CASH BUYER 28,255.00
CASH SELLER & SETTLEMENT 28,260.00
Tuesday, February 8, 2011
London Metal Exchange: Nickel
Nickel Prices Update:

CASH BUYER 28,700.00
CASH SELLER & SETTLEMENT 28,705.00
Since when I started to post the graph of nickel, nickel prices in the world market has gone up by 6.29% from 27000 last February 1
Link of the initial post: http://the-morningstar-option.blogspot.com/2011/02/nickel-price-graph.html
The target of the inverted head and shoulder pattern on the chart at 28500 has already been surpassed it coincidentally falls within the size of the possible upswing from the start of the move up to the break out point.
With this being said, Nickel prices in the world market could probably start correcting.
However, basing from the previous pattern, the upswing after the breakout has exceeded the inverted head and shoulder pattern by 25% more.
With that in mind, nickel prices still have a possible upside of 6300 per tonne.
Just my wild imagination!
*Ninja Edit:
Nickel is currently trading at $13/lb, higher by 6.12% since February 1 at $12.25/lb.
Nickel has risen by 13.92% from its 2010 price level.
Crazy forecast for nickel is it could reach a high of $16/lb.

CASH BUYER 28,700.00
CASH SELLER & SETTLEMENT 28,705.00
Since when I started to post the graph of nickel, nickel prices in the world market has gone up by 6.29% from 27000 last February 1
Link of the initial post: http://the-morningstar-option.blogspot.com/2011/02/nickel-price-graph.html
The target of the inverted head and shoulder pattern on the chart at 28500 has already been surpassed it coincidentally falls within the size of the possible upswing from the start of the move up to the break out point.
With this being said, Nickel prices in the world market could probably start correcting.
However, basing from the previous pattern, the upswing after the breakout has exceeded the inverted head and shoulder pattern by 25% more.
With that in mind, nickel prices still have a possible upside of 6300 per tonne.
Just my wild imagination!
*Ninja Edit:
Nickel is currently trading at $13/lb, higher by 6.12% since February 1 at $12.25/lb.
Nickel has risen by 13.92% from its 2010 price level.
Crazy forecast for nickel is it could reach a high of $16/lb.
Monday, February 7, 2011

Sunday, February 6, 2011
London Metal Exchange: Nickel
I think it would be very helpful to monitor nickel price in the world market in correlation to NIKL price movement (since watching the development of nickel price in the world market added conviction in staying with the trade).
Here's the updated graph after 4 days:

Here's the updated graph after 4 days:

CASH BUYER 27,775.00
CASH SELLER & SETTLEMENT 27,780.00
Thursday, February 3, 2011

Nickel Asia (NIKL)
NIKL Daily Chart Update

It also appears to be forming an ascending triangle with a breakout point at 20.80.
Target of the pattern is at 22.70.

It also appears to be forming an ascending triangle with a breakout point at 20.80.
Target of the pattern is at 22.70.
Tuesday, February 1, 2011
Nickel Price Graph
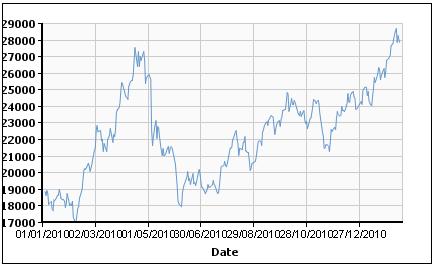
No idea if this chart could be read the same as reading stock charts or if this is the right chart at all but I am going to post it anyway:

IF it can be read the same way as any other stock charts, price breaking out of reversed head and shoulder would suggest a target of 28500.
That would be good for NIKL right? Just keeping my hopes up! Anyway, it is definitely trending up. Still good for NIKL right? Right?! Haha
**European markets are up by almost 1% as of this writing. Asian markets closed slightly higher. Hopefully the market recovers tomorrow(despite of the fugly chart).

IF it can be read the same way as any other stock charts, price breaking out of reversed head and shoulder would suggest a target of 28500.
That would be good for NIKL right? Just keeping my hopes up! Anyway, it is definitely trending up. Still good for NIKL right? Right?! Haha
**European markets are up by almost 1% as of this writing. Asian markets closed slightly higher. Hopefully the market recovers tomorrow(despite of the fugly chart).
Thursday, January 20, 2011
Nickel Asia (NIKL)
NIKL Daily Chart

From the looks of it, it is still a long way to go.
The higher end of the IPO price is my long term target.

From the looks of it, it is still a long way to go.
The higher end of the IPO price is my long term target.