Wednesday, November 3, 2010

RFM CORPORATION (RFM)

10-Year Daily Chart


RFM has finally taken out its major resistance P2 today with exceptional volume after consolidating in more than two weeks, suggesting the resumption of its uptrend in the intermediate term.

The resumption of the uptrend is pointing out at 2.85 as target in intermediate term.

However, current uptrend would seem to be advancing in a slightly lower pacing from its previous advances as pointed out by the fan lines.

6-Month Daily Chart


It has also broke out of its ascending triangle pattern today, pointing out at 2.27 as an immediate target.

There are still no signs of danger appearing on its weekly chart.

I am trying to be careful in trading break outs, specially when it is their first so I would be still on the sidelines here as it deemed to be much safer to wait for a pull back. I also set a rule in my system to sell the first break out and buy the second one so today should have been a sell IF I had a position.

A pull back to P2 should provide a good buying opportunity, or as close as possible. If it would be possible, below P2 should also provide good bargains.

RFM is also highly obedient of its trend/support line.

Short Term Target: 2.27
Intermediate Term Target: 2.85
Immediate Support: 2

Personal Disclosure

The market continued to advance further in today's session, gaining another 40 points, closing at 4381 today, higher by 0.92% from yesterday's closing. Major index contributors today are SCC up by 6.23%, VLL up by 6.06%, SMC up by 4.88%, and MBT up by 3.94%. Major losers today are FGEN down by 3.43% and CEB down by 3.39%. CEB is now down by 4.16% from its IPO price.

The market is now seem to resume its uptrend after consolidating for four weeks as MACD is now slowly turning up.

Riding with the bulls is now being led by AGI +10.24%, ICT +9.4%, DMC +9.31% and MPI +7.81% after they played catch-up with DMC after their presentation with Citisec.

AP continued its corrective consolidation today closing at 27.95, higher by 0.18% only from yesterday's closing. Rate of change are looking to turn up that might indicate the resumption of uptrend although it could still end up flat on tomorrow's session. Uptrend might resume from late this week to early next week.

DMC continued to advance today despite of its declining rate of change, indicating bearish divergence with the indicator. The latest divergence that I saw within my watch list was from MEG which resulted into sideways movement for about two weeks before it started to head back up. So there are now two things that are needing attention: divergence in price to volume and divergence in price to rate of change.

Or it could simply move in a boxed pattern.

AEV gave off a buy signal today. A strong opening tomorrow should confirm the buy signal although it still has to sustain its strength upon closing.

Amongst the five stock that I put up in my watch list yesterday, Atlas seems to be the most attractive stock to buy as it's the one that have fallen the most in terms of rate of change. Coincidentally, its price today closed at 61.80% fibonacci retracement level.

RFM has finally woken up from its more than two weeks of consolidation, taking out the heavy resistance at 2 today with exceptional volume, reaching a high of 2.12 before closing at 2.06. Target in the current uptrend in the medium term is now at 2.85. I'm trying to be careful now with stocks behaving like this so I'll wait for a correction for the mean time before taking a position here. Expect the previous resistance at 2 to provide support when it pulls back and it should also provide a good buying window. I'll be posting its chart later today.

AP is currently up by 3.26% in nine trading days. Doubled my position in AP.
DMC is currently up by 8.42% in six trading days.

*AT is looking attractive at current conditions so I am thinking of dropping DMC for it. If AT opens strongly tomorrow and sustains it, closing above the 10SMA, I'll buy it and will drop DMC. Much better if DMC surges up by 5%. If it does more than that, I'm just going to hold onto it.

So much for following your plans.

Tuesday, November 2, 2010

Personal Disclosure

The market gained a whopping 73 points today, with major contributors coming from the industrial and holding firms.

Riding with the bulls are now being led by AGI +10.24%, ICT +10.05%, MPI 8.04% after playing catch up with DMC with +8.02%.

AP is poised for further correction in the short term as the rate of change is still declining. Uptrend might resume from late this week to early next week.

DMC is poised for a correction in the short term as suggested by declining rate of change.

Out of the five stocks I put on my watch list, two of them opened strongly, namely AGI and URC as both gave off a buy signal on the weekly charts. Despite of not opening strongly today, the other three - AT, PX, and PNB also gave a buy signal on their weekly charts, suggesting a buy this week. I'm all tied up with AP and DMC already so I'll just be watching all issues to confirm my ideas. One thing I am uncomfortable with is PX candlestick which is seem to be forming a falling method.

AEV also gave a buy signal today on the weekly chart while AP gave a sell signal in the weekly chart. Besides that, there's nothing much to worry about the Aboitiz stocks. AEV has also a inverted hammer candlestick on its chart so it might advance ahead of AP in the short term.

AP is currently up by 3.07% in eight trading days. Doubled my position in AP.
DMC is currently up by 7.04% in five trading days.

AP 70%
DMC 17%
Cash 13%

*Sitting tight for the mean time. I am thinking of holding either of them till December to reduce stress when trading. I would probably use the remaining 13% or less for swing trading just to cure the itch when watching the ticker or for speculative/high risk stock positions. I think I had my fair share of roller coaster ride in the stock market already. Anyway, hopefully by year end, I have doubled my capital so I'll have a better room for elbow next year! Gotta squeeze everything that we can get out of this bull market!!!

Watchlist!

Stocks to look out for if they open strongly today!

ALLIANCE GLOBAL GROUP, INC. (AGI)
ATLAS CONSOLIDATED MINING (AT)
PHILIPPINE NATIONAL BANK (PNB)
PHILEX MINING CORPORATION (PX)
UNIVERSAL ROBRINA CORPORATION (URC)

And the Aboitiz stocks too - AP and AEV!

Everything is purely on technical basis~

*UPDATE!

Last week, I decided to look on to several stocks for possible trades. The basic requirement for them to be a buy is for them to open strongly. Let's see how did they fare this past week:

AGI: Fulfilled the requirement to open strongly on the opening of the market. However, it would seem that it did not sustain its strength to further advance through out the week, and it only formed short days(candles).

Weekly rate of change just started to gain strength suggesting further advances in price in the coming week or two.

AT: Despite of the increasing rate of change, its price barely moved. Therefore it did not fulfill the basic requirement for a buy.

However, the divergence in price and rate of change suggests bullish behavior so it could possibly spike up by next week - opposite of bearish divergence in price and rate of change which often results to relatively lengthy corrective consolidation.
(Just an observation).

Weekly rate of change just started to gain strength suggesting further advances in price in the short term.

PNB: Opened relatively weak on the start of the week which is directly the opposite of the buying condition. However, advanced fairly well which have led to either a whipsaw or not being able to ride the boat.

It is now looking to break its previous high of 73.50.

Weekly rate of change just started to gain strength suggesting further advances in price in the short term.

PX: Opened relatively well this week and was able to sustain it until last Friday as it met strong selling pressure at 15(gap - resistance; 61.80% Fibonacci retracement).

Weekly rate of change just started to gain strength suggesting further advances in price in the short term.

URC: Opened very strong this week although it wasn't able to sustain its initial strong opening.

Weekly rate of change remained flat because of the inability to sustain its daily gains. Its price movement on Monday will decide its own direction in the short term.

It is to be noted that four out of the five stocks in the list have a confirming buy signal on the daily and weekly chart: AGI, AT, PNB, and PX while URC remained neutral.

*Short term: 1-2 weeks.

Friday, October 29, 2010

Metro Pacific Investments Corp. (MPI)

6-Month Daily Chart


Looks like MPI has finally broke out of its resistance at 4 today, as it broke out of its ascending triangle pattern that formed this past 3 weeks. Immediate target of the said pattern is pointing at 4.42. Expect correction in the short term - 1 week worst case for those waiting for the correction.

I am now expecting it to fill its gap down from 4.70 in the intermediate term.

Personal Disclosure

The market closed slightly higher by 8 points as it continued to move sideways. Hopefully, we breakout of this sideways movement when third quarter earnings reports come out by early November. Technicals still haven't changed so don't expect much from the market.

AP continued to decline today losing 1.44% closing at 27.45. I am expecting it to decline further on Tuesday's session. If it does decline, it should provide a buying window.

DMC looks like its momentum has slowed down, gaining 2.28% today with relatively low volume. Technicals are still not showing any signs of weakness so there could still be more room to the upside.

The "laggard" companies from COL's briefing are one of the best performers in today's session as AGI played catch up, gaining a total of 4.42% after the briefing, closing at 11.34. MPI gained a hefty 4.38% today closing at 4.29 also breaking out of its ascending triangle pattern, gaining a total of 6.87%. DMC gained a total of 6.32% while ICT gained a total of 3.47% closing at 43. Looks like DMC is the fastest horse among them. Let's see how they perform next week!

Finally finished my back-testing on the first part of my trading system. Looks like I still need to refine it further as it only performed 70% during bull market. One thing I observe about it seem like susceptible to whipsaws so I need to add another filter to minimize whipsaws.


AP is currently up by 5.09% in seven trading days.
DMC is currently up by 5.25% in four trading days.

*Earnings report where are you~

Thursday, October 28, 2010

The Replacements

Consunji-led DMCI Holdings, Inc. (DMC), Lopez-led First Gen Corp. (FGEN) and Gokongwei-led JG Summit Holdings, Inc. (JGS) are going to take the places of San Miguel Corp. (SMC), GMA Network, Inc. (GMA7), and Security Bank Corp (SECB) in the index.

Full story here: http://bworldonline.com/main/content.php?id=20235

Personal Disclosure

The market closed 24.38 points lower from yesterday, confirming the further sideways movement in the short term and has also been pointed out of the loss of momentum reflected by the index' MACD and declining rate of change.

The declining rate of change and momentum confirms the further sideways movement in the short term.

No news is bad news.

AP declined for the second day by a total of 20 centavos. Declining rate of change and momentum suggests further correction/consolidation in the short term.

It seems that I was wrong in reading the price movement of DMC as it advanced further today by 4.04%. Rate of change is half-way through from it's previous peak so this current price movement may last by a day or two before heading for correction/consolidation.

One thing that should be a matter of concern in the short term is the divergence of price advances from volume.

I'll still be holding both till they reach my targets. Hopefully, targets are hit by the time the third quarter earnings report comes out.

Couldn't post much as I have been manually "back-testing" my fine-tuned trading system. I was almost done with the first part(bear market) when I suddenly realized that there was an error on the beginning of the testing so I have to re-do everything again. /epicfail

Companies that had their presentation yesterday at Resort World, Riding with the Bulls courtesy of Citiseconline, performed well today as DMC is up by 4.04%, ICT is up by 2.05% and MPI is up by 2.49%. However, AGI remained flat in today's session which I find somewhat ironic as they own Resort World.

AP is currently up by 6.62% in six trading days.
DMC is currently up by 2.91% in three trading days.

*Hold the winning positions as long as possible, keeping trailing stops active.
*Buy what is showing strength.

Tuesday, October 26, 2010

Personal Disclosure

The market closed slightly lower from Friday's session by 7 points (0.17%). If there would be no positive follow through tomorrow, I am expecting the market to continue moving sideways and looking to buy at 4146 levels.

AP still closed higher by 0.18% but the selling was pretty obvious today. Still having divergence in momentum and rate of change suggesting consolidation in the short term.

DMC advanced further today gaining 1.84%. However, weakening momentum and declining rate of change are now suggesting that the price is currently at its peak.

I was second guessing my decision in buying AP before as I might have seen what I wanted to see. It seems like I was not and AP moved considerably in my direction. Same case with DMC. However, it looks like I took the position relatively late as it seem to be trading at the top of its trading channel and still moving sideways.

Anyway, I'll be holding both of them for the meantime till they reach my personal targets.

AP is now up by 7.39% in five days.
DMC is now up by 1.84% in one day.

Monday, October 25, 2010

Long weekend is long.

The market has finally broke the resistance at 4250 after moving sideways this past week. If it is not a false breakout, 4350 is very possible in the short term. However, if it is a false breakout, look into buying within 4146 levels.

AP continued to advance last session gaining 3.90%, closing at 28. Looks like the gap is going to be filled as momentum is relatively top-ish with declining rate of change. Or it might consolidate for a few days before heading back up. Weekly chart is still pointing up so any weakness in the daily chart should provide buying opportunities with minimal risk.

AGI is poised to head up as suggested by the increasing rate of change and momentum. However, there seems to be a strong selling when it reaches 11.18 levels.

DMC advanced last Friday gaining 5.37% closing at 35.30 and it is still poised to head up further as the rate of change just started to point up. Price movement has also satisfied the buying condition.

MEG continued to consolidate last Friday, barely moved at 2.55 levels after breaking out of its symmetrical triangle formation. Immediate target at 2.90 once it resume its uptrend.

The candlestick of PX last Wednesday was confirmed as a hammer last Friday as it seem to reverse its current price movement in the short term.

AT continued to advance last Friday and it seems like it will have a continuation of its advance up to early this week.

Busy weekend so I didn't get the chance to edit and post charts of previous trades.

I sold AGI last Friday for 1% commission loss after holding it for the eight days and I bought DMC with the proceeds as my buying condition for it was satisfied, plus it looks better than AGI last Friday.

Bought DMC at 35.30, closed at 35.30.
AP is now up by 7.20% in 4 days.

*I increased my position in AP last Wednesday, buying at 25.60 and 25.85 not to average down - after buying at 26.60 - but it simply showed a trade setup.

Thursday, October 21, 2010

Personal Disclosure

The market gained 57.21 points at 4249.17 today, 1.28% higher from yesterday's closing, continuing to move sideways with a support at 4146 and resistance at 4250. Momentum and rate of change are now both pointing up and confirming each other, suggesting that there would be further advance in the short term. If both indicators confirm each other on the weekly charts by next week, the resumption of the uptrend would probably come earlier than I expected.

Top gainers for today are MER, AEV, AP and SMPH while top losers are mostly comprised by third liners.

AGI opened strongly at 11 before it was sold down by MACQUARIE and CLSA, closing at 10.86. Momentum-Rate of change reading right on the money. Today's reading is relatively different as momentum has started to gain strength while rate of change declined further. Resumption of the uptrend would be late this week to early next week.

AP continued to advance further today, gaining 3.65% today closing at 26.95, made a gap up from yesterday's closing. If the gap doesn't get filled tomorrow, immediate target would be at 28.80. Momentum and rate of change are still both pointing up suggesting further advance in the short term and both are still less than half-way from their previous peaks.

MEG would seem to consolidate further in the short term as momentum and rate of change are diverging from each other. Pull backs to 2.40 should provide a good entry. Target would be around 2.90 once it starts to advance (symmetrical triangle target).

DMC did continued to consolidate today. However, despite the diverging momentum and rate of change, it appears to me that it is ready to resume its uptrend as the momentum is starting to gather strength. Buy if price crosses over the 10SMA.

Still confused with PX as the latest candlestick doesn't seen to be confirmed much.

Lost my bet on AT as it advanced further in today's session. It would be safe to assume that it would advance further until next week as both momentum and rate of change are pointing up.

On the other hand, looks like I am right on ORE. Both momentum and rate of change just started to point down (from the peak) suggesting further decline in the short term.

I'll be posting charts of my previous trades later.

AGI is still sitting on commission/tax loss for seven trading days.
AP is now up by 3.18% in 3 days.

*In a relatively choppy market, buy what's showing strength.

Midnight Express

Market closed relatively flat in yesterday's session, dropping 43 points intraday before closing at 4191.96, slightly lower by 0.71 points only. Gainers are mostly comprised by third liners with AT and AEV as an exception while major losers yesterday are third liners too.

Looking at the charts, the index seems to be half way through consolidation, just in time for the third quarter company reports.

AGI seems like its about to resume its uptrend already, but momentum and rate of change are still pointing down so it might still decline tomorrow. However, if it does starts to advance again, tomorrow would be the earliest and early next week would be the worst.

AP bounced off today from support closing by 1.56% higher yesterday. Momentum and rate of change are pointing up already suggesting advances in the short term. Latest candlestick formation also suggests the same. However, I am second guessing my decision as I might have simply saw what I wanted to saw on the charts. Verdict tomorrow!

Looks like I am wrong on assuming buying on breakout on MEG as it opened and closed lower yesterday forming a bearish candlestick. Should the proper play for breakouts is sell the first breakout and buy the second one? 2.40 level is looking to be the next support.

DMC seemed to consolidate further yesterday as it is also being pointed out by momentum diverging from rate of change.

PX recovered today and bounced off its next immediate support at 12.90. However, I am still doubting the candlestick that it formed yesterday as I am unsure if it is a on-neck pattern or a hammer pattern. Only one way to find out, watch its price movement until the end of the week!

I am betting on two to three days consolidation in AT following its advance yesterday, basing it from its previous behavior. Let's see how it'd go.

ORE is one interesting issue. Die hard fans of this stock are jumping out of joy yesterday as it was one of the most active stocks with 3.98% gain. However, is this a reason to be jumping for joy?


Technically speaking, momentum and rate of change are relatively the same with its previous peaks suggesting price decline in the short term. But knowing that it is a jockeyed stock, I hardly doubt that my analysis would be right.

Anyway, I would be try to post a chart of this one since I profited around 30% from ORE before within two weeks.

AGI is sitting on 2.5% net paper loss (commission/tax).
Break-even at 11.15.
Six trading days.

AP is sitting on 0.46% net loss.
Two trading days.


*Sell on the first breakout (of range) and then buy the second break out.

Tuesday, October 19, 2010

Personal Disclosure

The market declined further in today's session losing 23.86 points, closing at 4191.25. Major index gainer today is MEG while major index losers came from the mining sector comprising of LC, LCB, MAB, and PX.

AGI seemed to have found support at current levels. However, both momentum and rate of change are still pointing to further decline in the short term. Weekly chart looks like its half-way through its decline so am expecting it to resume its uptrend late this week or by early next week.

ATR and JPMorgan seems to be accumulating as they are net buyers today with 31M and 1.9M (volume) respectively.

I forgot to post my analysis for MEG if it breaks out of trading range yesterday. It should have been buy on break out of the resistance at 2.55. Anyway, I still missed today's buy on break out for MEG as I left 30 minutes before the market's closing. Any pullbacks near 2.55 levels should provide opportunity to buy with a target of 2.90 from the the symmetrical triangle that it formed on the daily charts.

Major foreign buyer today is MACQUARIE amounting to 21.65M (vol).

Rate of change and momentum are both pointing up suggesting further advance in the short term. MACD is already pointing up and the fast line has crossed above the slow line confirming the continuation of the uptrend.

This is frustrating since I have a position in MEG in COL's virtual tycoon. /sadpanda

AP continued to decline further in today's session, losing 1.92% closing at 25.60. Momentum and rate of change are still both pointing down suggesting further decline in the short term. Declines up to 24.50 should provide buying opportunities with minimal risk.

Major buyers today are MACQUARIE, PEP, and DEUTSCHE.

DMC continued its corrective consolidation today losing only by 0.89%. Momentum and rate of change are diverging from each other suggesting further consolidation in the short term.

Major buyers today are DBP-DAIWA and JPMorgan.

PX broke down today from its support at 14 by more than 3% suggesting further decline in the medium term. Momemtum, rate of change and MACD are all pointing down suggesting the idea of further decline.

Next support at 12.76-12.90 levels.

Looks like I was right about MBT. Too bad I didn't get the "OK" signal to buy it. The only stocks that I have the "OK" sign to buy are: AP, AGI, MEG and DMC.

My position in AGI is still on commision/paper loss.

Monday, October 18, 2010

Personal Disclosure

The market continued to move sideways today, closing lower by 1.24 points. ALI was sold down today again down to 16 before recovering back and closing at 17.30. I now have the notion of buying ALI immediately once it drops by more than 5% for quick money.

AGI continued to decline today, losing by 5 centavos or 0.54%. Rate of change and momentum is still diverging from each other so I am inclined to believe it will continue to decline/consolidate in the short term. Its weekly charts looks like its half-way through its decline so am expecting it to resume its advances late this week or by early next week.

MEG met resistance from its previous high of 2.55 (tweezer top) and started to decline at that point. A bounce from 2.35-2.40 (gap) levels should provide a good entry if it is to resume its uptrend. A bounce from that level would also confirm the symmetrical triangle pattern that formed in its daily chart with a target of 2.90.

However, if it declines further beyond that point, expect a strong support at 2.20 levels and continue to trade the range. Furthermore, if it declines further beyond the 2.35-2.40 (gap) level, the symmetrical triangle pattern would be rendered void and would be replaced by an ascending triangle pattern, with a target of 2.80.

On the other hand, FLI moved sideways with a tighter range from 1.32 to 1.40. A possible symmetrical triangle pattern might also be forming on the charts.

PX dropped by 0.56% today. It is definitely forming a descending triangle pattern. However, as much as I don't like seeing spinning tops on the top of trading ranges as they usually signifies movement reversal in the short term, I pretty much welcome its appearance on the bottom of trading ranges. With a bounce from its current support of 14 should provide a good entry with a tight stop loss right below, with immediate resistance at 15. Breaking above 15 would suggest the end of the short term down trend and it would be resuming its uptrend.

However, if it does break its support at 14, expect immediate support at 12.76-12.90 levels.

I won't be watching RFM for the meantime or until it breaks its resistance at 2 and/or once it gains 10M daily turnover on up-days. Weekly charts seems to be forming rising three method (candlestick pattern) which seems to be pointing at 1.70 level as possible support.

AP started to decline today, losing by 0.76% closing at 26.10. Both momentum and rate of change are pointing down so it seems like it would be declining further in the short term. Pullbacks and rebounds from 24.67 to 25.27 should provide good entry points. Weekly charts are looking relatively weak so I am not expecting it to rebound up til early next week (at best).

DMC would seem to be consolidating in the short term. A bounce from 31-32 levels should provide good entry.

The selling of MBT looks like it was overdone/overly bearish for me. Buy if it advances tomorrow with immediate resistance at 71.92 up to 72.96.

My current position in AGI is still the same; sitting on half of commission/paper loss.

Saturday, October 16, 2010

Personal Disclosure

The market simply moved sideways this week as it closed 17 points - 0.40% lower from yesterday's session, closing at 4216.35. This market behavior would probably last till the next earning reports come in. No news is bad news.

AGI fell by 1.43% in the previous session, closing at 11.02 leaving my position virtually unchanged when I bought it. Divergence in rate of change and momentum is suggesting further corrective consolidation in the short term. Weekly charts is definitely pointing down now.

Of all the property stocks that I've been watching, MEG seems to be the one that showed greater strength among the three. Although it seems like it has peaked already at 2.50. Any rebounds from the support at 2.20 should be bought. Weekly charts also gave a buy signal so any weakness in the daily charts should provide a good buying opportunity. Breaking the previous high at 2.55 would be possible as soon as the MACD starts pointing up.

Not the same case with ALI as selling started to surface at the 18 levels. Bounces from 16.70 levels should provide buying windows with a tight stop right below it. Avoid if it breaks the 16.70 support levels.

FLI behaved like ALI although not as bad. Rebounds from 1.32 support levels should provide buying windows with a tight stop loss right below the entry point.
Avoid if breaks the 1.32 support levels.

PX is make or break at 14. Divergence in momentum and rate of change is suggesting consolidation though.

RFM closed unchanged yesterday. There was a slight loss of momentum although both indicators are still pointing up so the possibility of advancing and retesting the resistance at 2 is possible.

I missed the AP boat! /sadface

DMC is probably the only one I can ride with now for the mean time.

Wednesday, October 13, 2010

Personal Disclosure

The market opened 20 points lower today before gaining 27 points at the end of the session.

AGI gained another 3% today, half-way through my break-even point! Momentum and rate of change is still diverging from each other suggesting consolidation in the short term. Weekly chart is manifesting relative weakness suggesting selling on rallies although it might change if the stock finishes up strongly this week. Pull backs to 10 levels should provide nice buying windows.

RFM, PX, MEG, and ALI also rebounded strongly today.

ALI found solid support on 50-MA. Today could have been the best buying window for this stock, with immediate resistance at 18.42 levels. Very nice candidate for range trading. I am not expecting it to break its previous high at 18.70 in the short term as the MACD reading is still pointing down.

MEG bounced off strongly from its support at 2.20 levels, gaining 4% today. Momentum and rate of change have began to point up suggesting advances in the short term, with immediate resistance at 2.43. Breaking of the immediate resistance would suggest that the uptrend would resume. I highly doubt it though as MACD reading is still pointing down so I am more inclined to range trade at best.

Another property stock that caught my attention today while scanning charts is FLI. It formed a very bullish candlestick pattern today - Piercing pattern. Chances of this stock advancing tomorrow is very high with immediate resistance at 1.45. MACD is still pointing down so it would be range trading at best in the short term.

I am seeing a symmetrical triangle formation in PX. Today would have been the best time to buy it too and/or as close to 14 as possible with a very tight stop loss below 14. Bands are relatively flat so the possibility of range-trading is also there with immediate resistance at 16.

RFM is struggling at its current support - 1.79 - as both 10 and 50 SMAs are pointing out. RFM is behaving exactly as I've been expecting! Too bad most my funds are still frozen! Chances of breaking the resistance at 2 now is relatively high as MACD just crossed over the zero line. /sadface

It looks like I can ride AP once it resumes its advance next week though!

Rebound at 32 levels for DMC should warrant a buy signal.

Can't wait for my COL account to be activated hehe.

Tuesday, October 12, 2010

Personal Disclosure

The market made a relatively steep decline today, losing 1.24% - 52.27 points lower from yesterday, closing at 4166. Today is the steepest decline the index has made since the crazy run up that broke the previous high. It looks like the market is still poised to decline in the short term with immediate support at 4125.

I've not been writing much as I have been reviewing my previous trades, both gainers and losers to refine my system further. I am also currently transferring my funds to Citiseconline so my funds are generally frozen at the moment except for some that I've left on my live broker.

Bought AGI today at 10.84 with the remaining 30% of my active capital as I saw CLSA gobbling the shares up to 10.90 but wasn't able to sustain its buying before closing at 10.66 today. So that's 1.6% paper loss already. Got in too early but I wasn't able to monitor the market till the closing so that's the best choice I had today. Sell on rally as momentum in the weekly charts is showing relative weakness.

AP is looking very nice also as its MACD shows accompanied by relative trend strength. Pull backs to 24 is a buy but should wait for positive momentum to build up first as weekly charts is showing relative weakness.

RFM is still showing weakness on both daily and weekly charts so it is best to range trade it, support at 1.65 and resistance at 2.00.

PX looks like its about to bottom out on both weekly and daily charts so bounces from the support at 14 should warrant a buy with a immediate resistance at 16. If it continues to move this way, it might form a symmetrical triangle which would also warrant a buy at breakout.

MEG is about to retest its previous support at 2.20. Bounces from the said support should warrant a buy with immediate resistance at around 2.36 levels as it looks like it is forming a descending triangle. Breaking down the support at 2.20 would point to the next support at 2.13-2.15 levels. Breaking up the recent high at 2.42 would suggest the continuation of the further advance to the original target and should also warrant a buy. MACD is suggesting sideways to down movement in the short term.

DMC is also worth watching and buy as close to 31 as possible. Correction and bounces at 16.50-17 levels should warrant a buy on AT.

ALI looks like it got raped again today losing around 10% in three days.

Tuesday, October 5, 2010

Personal Disclosure

Market closed by 16 points lower in today day's session after gaining a hefty 76 points yesterday. Anyway, I posted my view on the market today so there.

As I've suspected, most of my favorite stocks are moving sideways. AGI, MPI, MEG, and FLI moved sideways today after advancing around 5% in the past two sessions. The only one that advanced strongly today is RFM. It looks like it has awakened from its six-week slumber. I can still remember my trading plan for RFM!

MPI could possibly forming an ascending triangle formation though. A convincing breakout at 4 should warrant a buy.

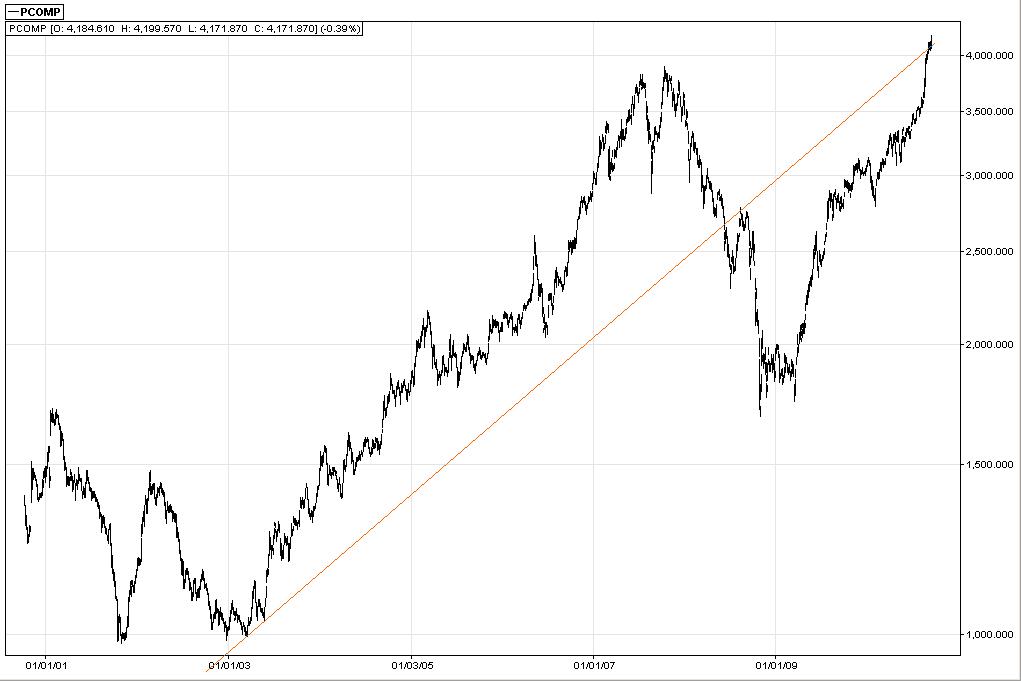
Philippine Stock Exchange Index (PCOMP)

Ten-Year Daily Chart PSEi


The previous advance from 3600 level was succeeded by continuous 1% gain on a daily average, breaking the previous high at 3896, before meeting slight resistance at the psychological resistance at 4000 which caused choppy movements in the recent advances. The breaking of the 4000 psychological resistance by 3% suggests that the current uptrend is still good and it is simply resting before heading back up.

Current MACD reading is suggesting that the recent high is currently at the peak of the uptrend as it has relatively the same MACD reading as the previous high at 3896 which is also confirmed by the current DMI reading.

The fast MACD line has crossed below the slower MACD line suggesting that there would be a consolidation in the short to medium term. Chances of making a combination of correction-consolidation is relatively average, possibly a retest of the now current psychological support at 4000 before heading back up.

There is a Momentum-Rate of Change to Price divergence, further confirmed the short to medium term consolidation being suggested by the MACD and DMI readings.

The market is now trying to break into the old support line (current resistance).

Support (Fibonacci Retracements): 4055 - 3943 - 3864
Psychological Support: 4000 - 3896


Monday, October 4, 2010

Personal Disclosure

Market closed 76 points higher today at 4188. Looks like the eleven-day consolidation finished yesterday.

Got whipsawed in MEG terribly as it closed at 2.39 today but you have to follow the plan. /sadface

Current position in DGTL is still lower by 7 centavos in six days. Didn't do much today except to watch the tape the whole time. I'm currently looking to range-trade some stocks if there is a viable trade setup.

I also found out a major flow in my current money management. It seems like I am exposing too much of my trading capital per trade!

Anyway, I am reading inverted charts again to see if the current trends and price movements are still valid.

Hello Monday!

Hello Monday! Looks like we're still poised for further consolidation-correction this week, courtesy of the crazy 500+ point jump this past month, plus no new news to push the prices. Quarterly company reports would be getting out sometime this month so there might be price action when that happens.

JGS is looking good as the IPO of Cebu Pacific is near. I might take a position here. Let's see how it goes tomorrow.

Thursday, September 30, 2010

Personal Disclosure

Sold MEG and FGEN for a significant loss today and I've pent all my of my gains from last month in three weeks. However, I found out what's wrong with my trades this month and market is not acting up within my expectations so I moved out.

I'll be watching the market for the meantime.

Back to square one. Synchronizing my trading month with actual months. My mind set is not really for medium term so I am going to use a shorter time frame now. No more trades for this week.

Food for thought

Looking back at my previous trades these past three weeks or so made me realize that I have been trading very badly as all of them are traded against my trading rules. I found out that I have been forcing money out of the market.

60% of what I gained on my first month, I already gave back to Ms. Market.

Goddammit, this is so frustrating.

Stocks go up in a bull market eventually. But timing and finding the best trades are far better than putting money recklessly.

I need to get out of the market to clear my system!

I wont be updating my trades for the mean time(more likely not on time) as I am keeping records on real paper now but I'll try to post charts from time to time to find good trades.

Wednesday, September 29, 2010

Personal Disclosure

The market was flat for the entire session before succumbing to further profit taking across the board, closing 13 points lower from yesterday's close at 4111. Top gainers for today are mostly penny stocks, UPM with the most significant volume but the value is still pathetic.

MEG fell to a low of 2.27 before closing at 2.29, lower by 0.43% from yesterday's closing. Rebound should be any time this week as ROC is pointing up although on a weaker momentum. Sell on rally would probably the best thing to do if momentum weakens further.

DGTL fell to a low of 1.59, same as yesterday's low before closing higher by 1.25% at 1.62. The stock formed a bullish harami-tweezer bottom, which is confirmed by ROC pointing up and momentum build up so I am expecting it to advance again in the coming days.

FGEN continued to consolidate in today's session as there are strong selling pressure whenever it reaches 14. ROC is pointing up but momentum seems to weaken so it might consolidate further at best. However, if the resistance at 14 is taken out convincingly, expect it to advance further with next resistance at 16.

Weekly charts of all three are calling for sell at rallies. It might be the best thing to do so I can assess the market better and take better position.

2-centavo paper loss in MEG - 13 trading days
7-centavo paper loss in DGTL - 4 trading days
10-centavo paper loss in FGEN - 3 trading days


I need to re-write my trading plan!

Tuesday, September 28, 2010

Personal Disclosure

The market was down by 18 points during the session before closing 1 point higher at the end of the session. CMT was the only one to advance significantly with high volume. Other significant gainers for today are EDC, AP, GLO and MER.

Could it be that foreign funds are now rotating back into the power sector? CMT is still play and up until now, I don't know what's the story behind its movement. They are under construction-infrastructure sector of the market but I honestly haven't seen any of their projects.

I am disappointed somehow on my performance these previous weeks. Jumping on the mining train too late, FGEN and DGTL(although a little late too) behaving opposite of what I've expected while following my trading plan. Maybe I should sell all positions so I can assess the market better. MEG is my saving grace as it is behaving the way I've expected it to do.

I was expecting FGEN to advance in today's session but it met a strong selling pressure instead and with relatively high volume too. Hopefully the resistance at 14 gets broken this week so it can advance further although I doubt it because foreign funds are net sellers the last seven days including today.

The selling continued today in DGTL plus foreign funds also started selling. The gap it made last Friday is being threatened to be filled tomorrow. Ready to cut. Again.

As I've expected, MEG touched my personal support at 2.26-2.28 but its low for today at 2.25 was 1 centavo lower from my support. Anyway, my personal support defended the said level as MEG closed at 2.30, 1 centavo lower from my entry. It could advance again anytime by now as my technical indicators are pointing. The net foreign selling these past seven days are making me feel uneasy though.

All three stocks looks bad on the weekly chart so I will try to sell all of them in rallies.

The possible reason why I am losing money this previous week is I could be possibly forcing money out of the market.

I've spent 60% of last month's gain already trying to figure out this market.

Monday, September 27, 2010

Personal Disclosure

The market stepped on my "Do not step" nerve as it closed 43.96 points higher courtesy of the big bad TEL gaining 1% today while the second liners that I am currently holding turned red at the end of the day. The market has finally closed 3% higher from the 4000-psychological barrier. It would be just a matter of days now to clear the uptrend in the long term.

MEG closed 1 centavo lower from my entry, showing a very strong selling pressure throughout the session which was accompanied by relatively high volume. ROC is still pointing down so my personal support at 2.26 to 2.28 will probably get hit. Weekly chart is suggesting medium term peak so I might sell on rally this week.

DGTL was also sold down the entire session closing 3 centavos lower from my entry at 1.66. This current behavior of this stock is something I can't understand(I still don't understand). A gap up followed which was accompanied with exceptional volume was immediately followed by a strong selling pressure with volume that was half of the previous session? Anyway, I am expecting the support from Friday's gap at 1.61 holds. Otherwise I would be cutting here again. Judging from other stock behavior, consolidation in the short term is also possible.

Bought FGEN at 13.86 today from the proceeds of MA which I also sold at a loss today. It is currently resting at the resistance but with the ROC pointing up and the volume traded today, it would be safe to assume that it will be broken this week with a target of 14.90 in the short term. It closed today at 13.88 with two centavo gain.

2 losing trades out of 5 trades in two weeks. The 3 remaining positions are relatively unchanged.

MEG - eleven days.
DGTL - two days.
FGEN - one day.

Maybe I shouldn't be pushing my patience by holding long onto my current positions. Previous holding time are showing better performance as they showed gains instead of unchanged position/losses.

Do I need to sell all of my current holdings to make a better assessment of the general market condition? Currently no mentor for this kind of market condition.

Sunday, September 26, 2010

DIGITAL TEL. PHILIPPINES, INC. (DGTL)

1 Year Daily Chart


Monthly, weekly and daily trends are up. Volume follows price movements (increases as price advances and decreases in price declines) so it is safe to assume the recent uptrend is healthy.

There is a reversed head and shoulder pattern that is visible in the monthly, weekly and daily charts, with the neckline at 1.64.

Broken neckline of reversed head and shoulder target: 2.33
Short term target: 1.85 (gap up target)

Support: 1.61
Major resistance: 2 - 2.44.

Alsons Consolidated Resources (ACR)

Monthly Chart


Monthly trend is up as pointed by MACD above zero line and 10-MA is above 50-MA. MACD histogram is suggesting that the trend has just began.

A rising method candlestick pattern showed in the monthly charts suggesting further price advances in the intermediate term.

Weekly Chart


Broke out of downtrend early this month that started November last year. Recent up trend is confirmed by the crossing of the MACD line over the zero line. However, the 10-MA is still below the 50-MA.

Latest candlestick formation is a bullish belt hold which supports the idea of further price advance in the intermediate term.

Daily Chart


Daily trend is also up but recent doji candlestick formation suggests short term peak.

SUMMARY
Monthly and weekly charts are suggesting price advances in the intermediate term so declines in the daily charts should merit a buy. However, it would be better to wait for the price to bounce back before taking in a new position.

If the price consolidates in the current levels, price advancing to 1.35 would merit a buy.

Price advances are accompanied by increase in volume so it would be safe to assume that the recent uptrend is healthy.

Support: 1.21
Resistance:1.60; if broken
Target: 2.50

Friday, September 24, 2010

Personal Disclosure

The market today ended relatively flat as it closed only by 11.44 points higher from yesterday' s session.

Today, I bought DGTL at 1.69 but it closed 1 centavo lower at 1.68. I am not bothered with the small loss though as it made a gap up from yesterday's closing with exceptional volume, almost five times of its daily turnover this past week. The PAR-SAR in the weekly charts also pointed this week as a buy. Immediate resistance at 1.76 while the target of the gap today is at 1.89.

I also took a small position in MA at .029 but it closed at .026 so this is another loss for me. I bought both issues too early today but it can't be helped. I think that the last thirty minutes is really the best time to buy.

Hopefully I can get out alive in MA or with a smaller loss. Weekly PAR-SAR just pointed a buy signal last week so it could still advance by next week. The reason I am shaky in playing this issue is I am not familiar with its behavior.

I probably should have bought MEG instead of MA with the remaining funds for swing trading.

MEG gave a buy signal today. It's now 1.71% higher from my break-even point.

I think I can use the lower PAR-SAR line as an indicator where to add up positions if the stock is still trending up strongly.

Sitting on a 12.80% net paper loss in MA on a small position, 1 centavo loss in DGTL and 1.71% net paper gain.

Charts later!

Thursday, September 23, 2010

Personal Disclosure

The market hardly moved today, closing up with 13 points higher from yesterday's session at 4067.43. The market could have closed lower today if not for the mining sector.

No trades for me today as I did some personal errands today so I didn't get to chase AT, but it gave a buy signal today. I'll try to buy tomorrow. PX doesn't seem to need chasing as it lost its momentum today.

MEG has finally declined together with my technical indicator, negating its bearish divergence that I thought was bullish. The bands are tightening so I am expecting a break in the near term. Support at 2.29 should hold. Currently formed a tweezer bottom in the middle of the trading range. Let's see how would this one perform.

I am looking for a day-trade/short term play in either ACR or MARC as 50% of my capital is free but I am still looking to average up in my position in MEG and in AT. PAR-SAR just gave out a buy signal in ACR last Tuesday while the buy signal in MARC was from last Friday. I think I can catch up the last upswing tomorrow.

LC/B could also provide a good day trading for tomorrow.

I have also been looking at the monthly charts for possible "long term" trades using PAR-SAR and I found DGTL as a possible candidate. ACR gave its buy signal in the weekly charts late September. PX, LND gave its signal early this month. MA and MARC just gave its buy signal last week. LC/B gave their buy signal in the weekly charts three months early! RFM and SFI has just began sending off buy signal so it might be worth watching in the coming months.

So in the case of LC/B, how early is early and how late is late?

8.28% net loss in seven trading days courtesy of GMAP and 0.86% loss in MEG.

*I am assuming that the height of the ascent during spikes is also the time needed during consolidation. This is would be true, the index would advance again after four more days of consolidation.

Wednesday, September 22, 2010

Personal Disclosure

The market slid by 69 points during the day before gaining half of it at the end of the session closing at 4054, 34 points lower from yesterday's closing. Our foreign friends are net buyers today compared to their miniscule buying yesterday. The market needs to hold at this level to confirm further uptrend in then near term. However, if it does not, expect the market to drop up to 3872.

Today, I sold GMAP with 8% loss as I did not like its behavior today plus the fact that foreign selling was a little bit obvious. Another reason why I sold it was PX gave off a buy signal today from my technical indicator but I didn't get to buy it because of the lack of available funds. The support at the previous gap up at 14.40 held as the price bounced off from that level today.

AT is also about to give a buy signal from my technical indicator tomorrow. However, the triple screening system has already given a buy signal on both issues.

Both issues also NFB today.

I'm hoping to play catch up on these two tomorrow.

MEG has also a net foreign buying today after they sold it down yesterday. I was wrong to assume its behavior last week as bullish divergence. From the looks of it, it is poised to consolidate further or it might correct in the near term. If it makes a correction, I am expecting 2.39 to provide support. If 2.39 breaks, I am expecting it to decline up to 2.28.

8.28% net loss in seven trading days courtesy of GMAP.
1% net paper gain in seven trading days courtesy of MEG.

*It seems like tweezer formation is a reliable support confirmation rather than pointing out peaks. Or they could be possibly more effective in pointing out peaks in trending issues that shows weakness.

**It seems that a correction to the 23.6% retracement level provides support to stocks that are advancing in an accelerated pacing.

Tuesday, September 21, 2010

Personal Disclosure

The market today closed positively by 34 points but slightly lower from the day's high as profit taking was seen across the board.

Profit taking by major brokerage houses are seen throughout the session in MEG as it closed 1 centavo lower from yesterday's session, closing at 2.46. Seems like they are distributing now. Support should hold somewhere at 2.30 once it makes a correction. Volume today are much higher than last week's advances. Technical indicators are still pointing down so I will not be surprised if it continue to decline this week.

GMAP closed by 2% higher today as ATR seems to be accumulating, while JPMorgan has been a net seller today. I am contented with the confirmation today so I still held on to my position. Technical indicators are pointing up now so it should advance anytime by now.

PX also met strong selling in today session closing 4.79% lower from yesterday, forming a dark cloud cover. Technical indicators are also pointing down. The support at 14.40 should hold. This could provide a place for fund rotation once I get out of GMAP or MEG, whichever reaches their targets first.

Technical indicators are also declining rapidly in AT. 13.46 should provide some solid ground for support.

Still sitting on a 4.29% net paper gain in MEG while sitting on a much lower net paper loss at 6.51% with GMAP.

Monday, September 20, 2010

Personal Disclosure

The index closed 74 points higher at 4053, closing 1% higher from the psychological resistance at 4000. I am confident to say that it will continue to move higher this coming days and it might break the psychological resistance by 3% this week.

PX made a gap earlier but some profit taking pushed the stock slightly lower but continued to move higher by mid session as it buyers started to push the price higher, breaking the the next resistance level at 16 by more than 3%, gaining a total of 16.29% in today's session. The risk in comparison to reward is now too high if you didn't get in the 13-14 levels. Next resistance is at 19.50. Buy on weakness.

EDC did what I expected it to do and I am still expecting it to advance in the next few days.

DGTL seemed to formed a buy signal today while RFM continued to move within consolidation range.

MEG seems to be forming a bullish divergence as my trusted technical indicator is pointing down but the price movement is advancing which is also accompanied by high volume.

GMAP looks like it has formed a bullish harami today so I did not sell yet. If the harami is confirmed tomorrow, I will hold. If not, I will sell.

Currently sitting on a 8.28% net loss courtesy of GMAP and 4% net gain courtesy of MEG.

Personal Disclosure

Citiseconline finally went back up last Sunday. Anyway, I finally made some possible trades for this week. Hopefully, funds rotate back now to my side of the fence.

Other stocks worth watching this week are EDC and DGTL.

EDC finally broke its major resistance at 5.60 and it reached its recent high at 5.86 before it was sold down the next day as low as 5.49 before closing up at 5.68. I am more inclined to think that the piercing back below the support is not enough as it only pierced old resistance intraday. The recent candlestick formation also looks bullish enough to warrant a buy. However, the trading range to the next resistance at 6.24 level is too tight for me so I don't think I'll be taking a position here.

DGTL also finally broke out of its recent downtrend which was accompanied by high volume. 10-day MA has also crossed above the 50-day MA. I would try to buy as close to 1.48 as possible.

Another stock that I get asked alot is RFM. I believe that RFM will continue to consolidate in the near term. Breaking 2 with high volume will warrant a buy signal with an immediate target of 2.20. Breaking 2 will also point to 2.85 as a possible target in the intermediate to long term. However, if it still doesn't break 2, I am expecting it to consolidate within the range of 1.80-2.00.

I think I finally found out how PAR-SAR actually works.

I think that's about it for now. Monday, here we go!

Caveat.

Philex Mining Corp (PX) Update

10-Year Weekly Chart


MACD is moving towards the zero line but it is still trading beneath the zero line.

DMI reading suggests that the recent trend is still gathering momentum.

10-day moving average is still under the 50-day moving average suggesting downtrend in the intermediate term. Uptrend in the long term is still intact as both moving-averages are trading above the 200-day moving average.

Weekly trend is up.

1-Year Daily Chart


After a year-long down trend, PX finally broke out of it last September 2 with relatively high volume. Breakout points to 14.63 as target, 4.5% away from its recent close at 14 and closing above its 200-day moving average at 13.

It now closed at 14 which is its next psychological resistance after breaking 13. A 1-3% break from it should warrant a buy signal. Breaking out would seem imminent as ROC is still pointing to further advance in the near term.

Major resistance at 16 and 20.

***The stock did reached 13 as I have anticipated before. However, I was expecting it to make a correction before heading back up but in the contrary, it simply consolidated before it started to head back up which I did not look into.

Sunday, September 19, 2010

Atlas Consolidated Mining (AT)

10-Year Weekly Chart


Atlas broke the neckline of its reversed head and shoulder early last week at 12 which was accompanied by exceptionally high volume, pointing at 22.40 as a possible price target. It is now approaching its major resistance at 17 and only 11.63% away from its recent closing at 14.78.

MACD reading is relatively bullish, and DMI reading is also suggesting that current uptrend is relatively strong.

10-day moving average has finally crossed above the 50-day and 200-day moving average confirming the uptrend.

Weekly trend is up.

1-Year Daily Chart


Rate of Change is still pointing up suggesting further advance in the near term.

DMI reading suggests the current trend is relatively strong. Recent new highs are accompanied by heavy volume, confirming the validity of uptrend.

Technical indicators are suggesting that the price is relatively at the peak already in the short term, giving a relatively high risk-low reward if one is to take a position at the current price. However, pullbacks would provide good buying opportunities.

A pullback to 14.42 should provide good entry.

Daily trend is up.

To provide a different point of view:

10-Year Weekly Chart flipped upside-down


Breakdown? Assuming shorting is allowed in our market, will you short this stock with this setup?

Caveat.

Rage quit!

Citiseconline is down until now so I can't do anything this weekend. Hopefully they go back up before Monday so I can make plans for next week.

Friday, September 17, 2010

Personal Disclosure

The market today closed by 26 points lower from the 4000 level, closing at 3979. It was basically correction time for most stocks today.

GMAP is still holding up at 7.35 with so much volume traded today courtesy of the big block sales by certain brokerage houses. Are they accumulating or distributing? The verdict is on Monday and I am ready to cut!

MEG seems to be encountering strong resistance at 2.40 slightly breaking above it but not enough as the penetration is less than 3% therefore I am expecting it to correct early next week or it will consolidate for the mean time.

I was right that there would be immediate resistance at 13 but I did not expect it to consolidate instead of making a correction. Anyway, it moved up today, slightly penetrating the next resistance at 14 but not enough to merit a buy. I'll observe how this one will go by Monday.

AT also broke its resistance at 14 by more than 3% today. I saw a buy signal yesterday but I did not took it.

I think PX has better risk-reward in comparison with AT so I am more inclined to buy PX instead of AT. I'll see how both go on Monday.

Which one is the faster horse? GMAP is one sick horse for sure.

Month 2 Day 5
Sitting on a 8.90% net paper loss courtesy of GMAP.
Break-even with MEG.

*I am now also trying to add the triple screening to my system. It is somewhat identical to the basic principles of my system. It is somewhat more defined so I might have gotten the idea from the article subconsciously. Anyway, it still can't solve my problem with spiking movements, from breakouts and consolidation. Maybe I am taking it the wrong way, or it simply cannot work well in this current conditions.

**The probable psychology of a candlestick opening lower the middle band and then closing above the upper band is the buying might have been overdone, thus the succeeding session results in profit taking or indecision. I'll post some charts regarding this.

Thursday, September 16, 2010

Personal Disclosure

The market decided to climb up again today as it gained another 31.98 points, closing slightly above the new territory at 4005. However, blue chips are left behind as third liners decided to take the reins.

GMAP is struggling as it still closed lower today from the previous day at 7.40. However 7.35 seems to be providing solid support for the mean time. The declining volume with the price decline would appear to me as a bullish indication. I am being bias though so the cut loss point still stands.

MEG continued to climb today contrary to what I was expecting, breaking the huge seller at 2.39 before it was sold down and closing at 2.37. But it's not like I am complaining. I'll be adding more position here once it makes a correction.

After the shooting star that AT formed, it was followed up today with a bullish engulfing, pointing that the 15.62 gap up target valid. FGEN continued to climb today but profit taking ensues, driving the prices down. Immediate support at 13.08.

Month 2 Day 4
Sitting on a 9% paper loss courtesy of GMAP and MEG. Most of the losses are from GMAP as MEG is simply 1 centavo away from break-even.

Wednesday, September 15, 2010

Personal Disclosure

Well, looks like the market has finally taking a breather as it closed by only 5 points up from yesterday's session.

I was basically watching GMAP the whole time, as I was waiting for it to break 7.35 and cut loss. Luckily it held at 7.35 so I just held on to my position. If I followed my original trading plan here, I could have gotten in today with minimal risk. Anyway, it closed today with a tweezer bottom so I am expecting it to head back up again. I'll cut instead if it goes the other way around.

MEG didn't do much today as it closed at 2.32, .01 centavo lower from yesterday. I am still expecting it to go lower in the next few days.

AT closed with a very ugly shooting star pattern today. Immediate support at 13.26.
FGEN continued to move up as it made a gap today. I'm expecting it to move up again before making a correction.

Hopefully, my candlestick reading today for both position is correct.

Month 2 Day 3
Sitting on a 12% net paper loss from both positions.

Tuesday, September 14, 2010

Megaworld Corporation (MEG)

Here is the 2-year daily chart of MEG


It broke out of 2-year resistance. With the unfilled gap at 2.15, I doubt that it will go back below 2.

Is MEG a buy with this current condition?

Now, testing something I read before, I am also now trying to see it a new perspective:


Assuming that short-selling is allowed in our market, would you short MEG in this condition?

Caveat.

Personal Disclosure

The market finally started to correct today as it closed 4 points lower from yesterday's session at 3968. I'm expecting the market to decline further for another two days minimum (but it could extend to five days) before heading back up again.

GMAP closed 3.87% lower from yesterday's closing, leaving me with -8.26% net. The gap at 7.45-7.48 was closed today. If price continues to hold at this level, I am convinced that this decline is simply a healthy correction. However, if it continues to drop, I am ready to cut loss. This one currently belongs to my expensive mistakes whenever I decide to do something stupid.

MEG continued to advance today closing at 2.33. Latest candlestick looks very ugly though. 2.23 should provide a good re-entry once it corrects. I am also expecting it to correct for another day or two before heading back up again.

If GMAP doesn't move up and continues to consolidate once it established a support, I will still cut loss and add up my position in MEG. GMAP has time to move up until MEG corrects.

AT and FGEN are the best performers today as they gained 13.26% and 13.06% respectively with exceptional volume.

20% per trade in a bull run seems like a piece of cake. Trade execution is probably my current problem.

I think I would be sitting through the entire second month with my current positions as the commission is killing me. I'll try to swing trades once I open an account with Citisec.

Month 2 Day 2
Sitting on a 8.26% paper loss with GMAP and 3% commission loss with MEG.

Way to start my second month!

Trading plan: Sit tight and get ready to cut the losses!


*Candlesticks that opens below the middle bollinger band and closes outside the upper band suggests peak in the immediate future.
*Tweezers seems to be more reliable when they are in the middle of the trend.

So you wanna be a trader?

Click!

http://www.financemanila.net/2008/03/so-you-wanna-be-a-trader/

Monday, September 13, 2010

Personal Disclosure

Wow, I am out of words. We are still trading in the green zone after ten trading days, up by 70 points closing today at 3972. Before, everybody was expecting to meet a strong resistance at the previous high.

Foreign buyers are still on buying frenzy today so I decided to jump in too(while holding my breath)!

I bought GMAP earlier today at 7.90 but it closed lower at 7.75, netting 1.89% loss today. The reason I bought GMAP today is to satisfy my father's wish to buy it. Technically though, it looks really ugly in the short term in terms of candlesticks and my other technical indicators. The only indicator that's keeping me relaxed with my current position here is its volume. Increasing volume with ascending price movement. How bad can it go? 10-day moving average has also crossed above 200-day moving average confirming the uptrend. It broke out of its major resistance at 7.70 but it is still struggling to hold up so it still might correct in the immediate future but I am expecting it to hold above the gap up before at 7.48.

I also bought MEG at the end of session at 2.31, which I should have bought earlier. I have no recent analysis for MEG here in my new entries but I have been monitoring and analyzing it while I was holding DMC before. Breaking my personal three-year resistance at 2.15 today with exceptional volume is the reason why I bought MEG. It also made a gap up at 2.15 from 2.13 which should have been enough to merit a buy earlier. It should also provide a strong support once it corrects. I am looking at 2.56 as a possible target in the short term.

Another stock I have been monitoring closely is MPI. It's now about to break out from its ten-year(weekly) down trend at 3.90. If it makes a convincing breakout at 3.90, I am expecting it to close its previous gap down with immediate resistance at 4.40. The probability of breaking out is relatively high because of the multiple moving average crossover.

Keeping a tight trailing stop in the current bull run is probably a mistake that I put up in my trading system. Maybe I should loosen up my trailing stops now?

Tight trailing stops would probably work best in a trending mode with normal pacing.

I still haven't figured out how to trade this crazy market!

Day 1, second month of my trading system.

Trading plan: Sit tight!

Thursday, September 9, 2010

Personal Disclosure

The index broke out of its previous peak at 3873, closing with 97 points up at 3902, stronger than . People say it's officially a bull run now. So maybe this time, I need to find the faster horse :)

My bid at GMAP didn't get hit today after it met strong selling once it reached 8. I probably should have held on to my position in DMC which I sold last Monday at 24.20 as it still went as high as 26.10 before closing at 25.60.

I observed this week that my new trading system is not fit to trade this market behavior. It is only good in trading trending market in normal pacing so I need to figure out how to trade in this new environment.

Second month for the new trading system. I am hoping for a buying opportunity by Monday or Tuesday.

Wednesday, September 8, 2010

Personal Disclosure

Asian markets closed in the red zone today and European markets are still trading in the red zone as of this writing. US Futures are also in the red. I wonder how the market will react tomorrow as we still ended up green with 29 points after ALI went back to its normal pricing that sent the market 50 points lower earlier in the session.

Still no trades for today, still waiting for entry points. However, I looked for rotational plays today when my primary trades goes for corrections and I found two possible trades. I will try to study their behavior for the mean time.

BDO continued to trend up for 10 days straight now, gaining 15.80%. I'm surprised by its movement though as I was not expecting it to trend continuously. It might reach 60-62 before correcting back. I am expecting it to consolidate when it corrects.

One-trading day left for the first month of my new trading system.

DMCI Holdings (DMC)

Trading Plan

Entry: 23.37 - 22.90 - 22.42
Target: 26.42 - 27.37
Cut loss: 21.84


Gap up at 22 suggests immediate support, pointing at 25.15 as target.
Currently trading at all time high.

Metro Pacific Investmenst Corp. (MPI)

Trading plan
Entry: 3.55 - 3.50 - 3.43
Target: 3.94 - 4.06
Cut loss: 3.36


Gap up at 3.62 has been filled. The gap up at this level is possibly an exhaustion gap before correcting.
Gap up at 3.40 suggests immediate support, pointing at 3.82 as target.
Major resistance at 3.80.

GMA Holdings (GMAP)

Initial trading plan
Entry: 6.65 - 7
1% Bounce from entry: 6.71 - 7.07
Break-even: 7.20
Psychological resistance: 7.70 - 8.10
Major resistance: 8.60
Cut loss: 6.40 - 6.76

New trading plan
Entry: 7.30 - 7.08 - 6.93 - 6.76
Target: 8.11 - 8.43
Cut loss: 6.56


Formed a tweezer bottom suggesting an immediate support at 7.30 in the short term.
Gap up support at 6.65, pointing at 8.30 as target.

Alliance Global Group Inc. (AGI)

Trading Plan

Minor Trend - Short term
Entry points : 7.12 - 6.97 - 6.81
Target: 8.16 - 8.48
Cut loss: 6.65


Intermediate Trend - Medium term
Entry points: 7.06 - 6.88 - 6.70
Target: 8.23 - 8.59
Cut loss: 6.48


Major Trend - Long term
Entry points: 6.79 - 6.52 - 6.25
Target: 8.50 - 9.04
Cut loss: 5.93


Formed a tweezer top suggesting short-term peak.
Gap support at 6.87, pointing at 7.79 as target.

Caveat.

WOW Philippines!

Tuesday, September 7, 2010

Personal Disclosure

Nothing happened much in today's trading as we were down by 5 points when I left while I was basically waiting for buying opportunities. When I got back, the market closed higher by 31 points courtesy of ALI gaining 10% for the day closing at 18.

GMAP reached my predicted price and it is now starting to correct. DMC began to correct today as the recent ascend was unsustainable. AGI still bounced strongly after being sold down last week and it is now beginning to correct also. I am more inclined to buy AGI though since I already know how it moves.

What I need to do now is to find stocks to rotate my funds with as I have no trades the following week after I liquidate. MEG, FGEN, JFC, and BEL are possible candidates for rotation. However, I am a bit unsure with the trend strength of BEL. We'll see how it goes.

Will write my trading plan this week. Still waiting for entry points.

Monday, September 6, 2010

New Trading System

After 14 days of testing my new trading system, I have only gained 38.32% of the initial target(25% of capital). With six-trading days left for my new trading system, I don't think I can find a trade to make up for the 61.68% that I have not gained yet after 14-trading days without putting my trading capital at a high risk as the general market has already climbed so much this past week.

First mistake that I made with my new trading system is I didn't wait for corrections to fully mature by taking up positions prematurely as I have done with MPI as my technical indicator has not confirmed my entry before, thus prolonging my exposure to market forces too long.

Second mistake that I made was not pulling the trigger fast enough. This happened when I took a position in FLI and not selling it when there was a clear sell signal. I could have simply taken another position with lower cost as it fell to 1.15, .04 centavos lower than my original cost. Or I could have added the proceeds of FLI to my recent position in MPI. Holding longer than more than 5-trading days are exposed to missing more profitable opportunities.

The third and last mistake is waiting for too much confirmation which happened to basically all the trades I made with the exception of cutting my losses in FPH.

Another weakness I found out with this trading system is that I have no stocks to rotate one my funds once I close out my positions, leaving me waiting for five-trading days for my current positions to correct.

3 out of the 4 trades came out successful within the 20-trading day limit, with 6 trading days left. I am pretty sure that there's a computation for success rates so I will not compute it as I don't have the formula right now. Gotta check my other notes.

FGEN - 4.83% Net loss - one-trading day
FLI - 6.25% Net gain - eleven-trading days
MPI - 8.20% Net gain - seven-trading days
DMC - 10.50% Net gain - six-trading days

Trading settings:

1. 1-2% bounce from entry price should be enough to warrant a buy. The allocated bounce from entry is there to minimize the risk of the trade going south and cutting loss.
2. Holding time is now back to five to six-trading days, depending on trend strength and momentum but should not last for more than 10-trading days.
3. Never take positions prematurely. Current technical indicator is good in pointing out good entry timing.
4. Find a faster way to pull the trigger in trailing stops.

Also, the technical indicator I am using is very useful in pointing out entries but it is relatively weaker in giving selling signals so I still need another technical indicator that sends off better sell signals. Williams' Percentage Range (%R) might be good but I still need to test it to see if it works in trending positions.

Overall, my new trading system only gained 9.63% of total capital. It's not bad but I am not impressed. I still need to work on pulling the trigger faster once the trailing stops get hit.

Personal Disclosure

The market opened strong in today's trading with a high of 3787 but most traders locked in their profits today driving the index lower gaining and closing with 9.4 points only. Today might be the start of the correction as the candlesticks are showing a scary shooting star - possibly evening star in the making. Possible support at 3620. If it does otherwise, the market is running into the danger of overheating.

By mid-session, I decided to take profits and close out my positions in MPI at 3.66 with 8.20% net gain and FLI at 1.30 with 6.25% net gain, as both trailing stop got hit. I could have sold MPI for more but a misunderstanding happened with my broker today as they were seeing 3.71 in the bid but I was seeing 3.69 already so I decided not to sell just yet. When 3.68 bid side was demolished, I decided to sell at market which was 3.66 already as 3.67 was easily sold down. The error cost me 1.10% in that trade, .04 centavos off my trailing stop.

Later in today's session, the support in DMC collapsed steadily, closing at 24.20, the same level I closed my position with a 10.50% net gain.

Overall performance, DMC outperformed all the other stocks I held, taking me by surprise as it has relatively low risk with high reward performance. Performance was also confirmed by the length of holding time vs the profit it gained. DMC gained 10.50% within six-trading days, MPI with 8.20% within seven-trading days, and FLI with 6.25% within eleven trading days.

Most of the stocks that I held closed with bearish patterns. MPI and FLI both closed with bearish engulfing while DMC closed with a shooting star, all are enough to merit a sell signal.

Now that I closed my positions early this week, it's now a waiting game to find possible entries in GMAP, GMA7, PX and in DMC again. I need to write a trading plan for these before the weekends.

Personal Disclosure and trading plan for this week

DOW closing another +127 points last Friday is still making me bullish. However this might be a sign of impending correction this week. I still believe that the correction might come late this week, possibly on Thursday as Friday was declared as a non-working holiday in recognition of the end of Ramadan. I am looking at 3595 as possible support once the market makes a correction.

Basically, the trading plan for this week is to look for possible exits.
FLI has started to show weakness in the charts. However, it still needs confirmation before taking action. MPI has also shown weakness as shown in its rate of change. Possible exit at 3.82 once weakness surfaces. DMC seems like it lost momentum and it's ready to make a correction, possibly forming the usual rising three methods. This might be the only one I'd keep as it only makes small corrections before moving back up again. All trailing stop are now active, maybe with an exception to DMC. Let's see what happens this week.

PX, GMAP and GMA7 might also be worth looking this week.

Monday!

Sunday, September 5, 2010

Metro Pacific Investments Corp. (MPI)


It appears that the stock has broken out of its uptrend channel the last week and it is now trading within the gap down that was formed on September 25 last year. It also looks like it's about to test a major resistance at 3.80, with a higher possibility of breaking it as the volume accompanying with the trade last week is relatively high. The MACD crossing above the zero line and the
10-week moving average crossing 50-week moving average also confirms of the further ascend. OBV reading also suggests that the price movement is normal(bullish) as it fluctuates together with the price movement.


Six-month daily chart analysis


Price movement accelerated further after breaking out of its downtrend, confirmed by the crossing-over of the 10 and 20-day moving average over the 200-day moving average which was accompanied by high volume. DMI reading also suggests that the current uptrend is very strong. However, the weakening of the ROC should be a concern as it might be a warning of weakness in the short term.

Major resistances are at 3.80(short term) and 4.70(long-term).
Major support is at 3.62(short term).

Ideally, the stock should reach 3.86 before making a correction and heads back at 3.62.

*UPDATE


Two-Year weekly chart analysis

Broke the resistance at 3.75. Expect to retest 3.75 before moving up again.


Is MPI a buy or sell?

Caveat.