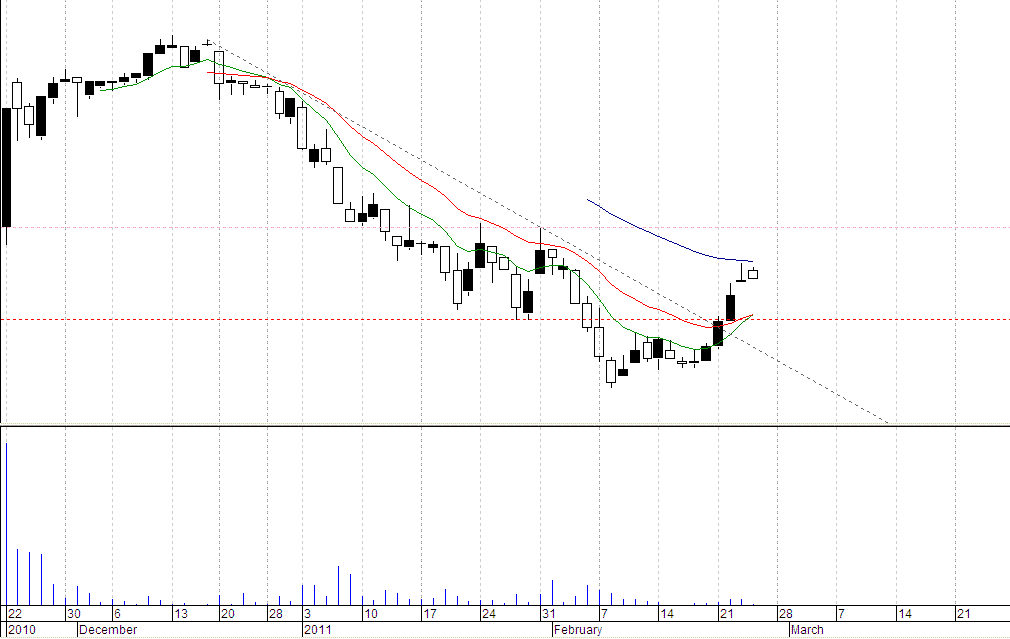
DMI reading suggests strong uptrend so I think buying on pullbacks on 9SMA or 20EMA can be applied to trade this one.
Pullback after breakout(26.55 - bounce) can also be applied for a better position.

Gokongwei stocks are definitely moving.


“The 52-week new highs on Friday rule” is usually applied to the market itself and not to an individual stock.
Rule number 1: On a new 52-week high, when the market closes at or close to its high on a Friday, buy long and go home long for the weekend.
Rule number 2: Exit the long position on the opening the following Tuesday.
Rule number 3: If the market opens lower on Monday, exit the position immediately.


AP
29.85
28.95
50,000
1,447,500.00
-45,000.00
BDO
48.90
50.80
35,000
1,778,000.00
66,500.00
DMC
38.85
37.85
44,000
1,665,400.00
-44,000.00
ICT
42.00
41.50
23,800
987,700.00
-11,900.00
JGS
18.98
25.30
10,000
253,000.00
63,200.00
MA
0.031
0.031
4,900,000
151,900.00
0.00
MEG
2.17
2.06
70,000
144,200.00
-7,700.00
MER
226.80
251.40
8,000
2,011,200.00
196,800.00
PX
14.16
14.84
100,000
1,484,000.00
68,000.00



FEBRUARY 2011
18
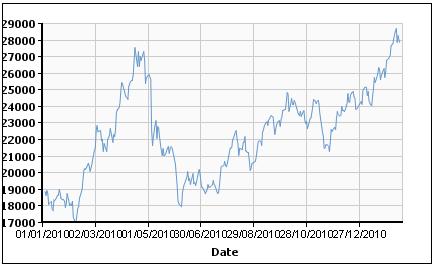
17 129924 28295.00
16 130248 28550.00
15 130248 28895.00
14 130422 28670.00
11 131112 27830.00
10 131898 28005.00
09 132330 28255.00
08 132936 27850.00
07 132828 28700.00
04 132798 28070.00
03 133500 27775.00
02 134172 27710.00
01 134442 27650.00
JANUARY 2011
31 134040 27070.00
28 134298 26820.00
27 135186 26795.00
26 134862 26150.00
25 134958 25750.00
24 135174 26265.00
21 130248 25850.00
20 137124 25645.00
19 137238 26190.00
18 137352 26355.00
17 137766 25985.00
14 136302 25460.00
13 136662 25720.00
12 135096 25060.00
11 135864 24590.00
10 136806 24045.00
07 136896 24340.00
06 137040 24870.00
05 136860 24640.00
04 136890 25170.00
Monthly Average: 25638.50


CASH BUYER 28,670.00
CASH SELLER & SETTLEMENT 28,680.00




http://www.guerillastocktrading.com/lessons/im-a-jerk-which-stock-chart-is-better-part-2


