Tuesday, July 5, 2011

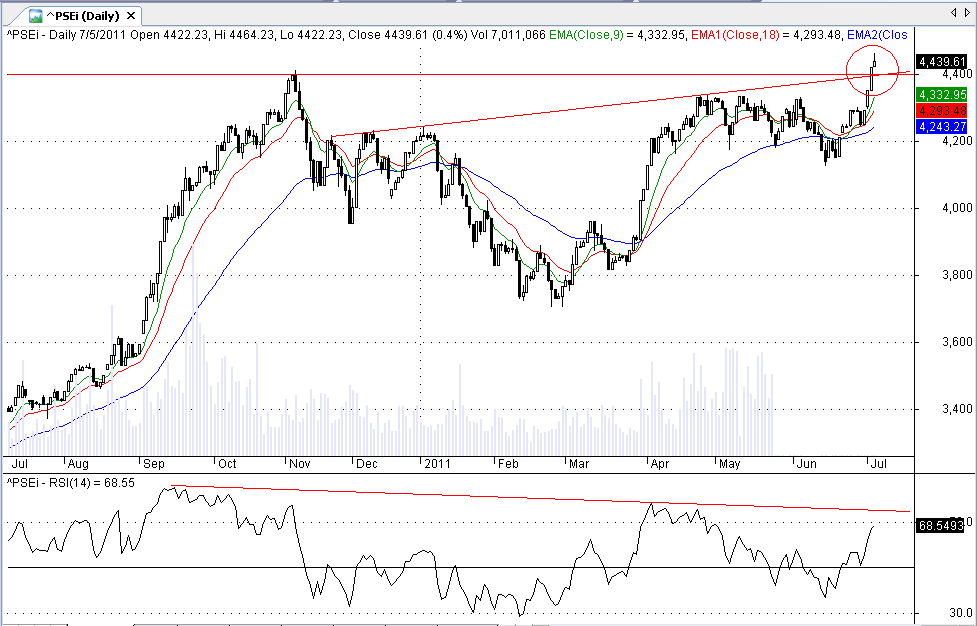
PSEi: Heading towards new highs?


Obvious bearish divergence. If divergence is still present after 3 pushes to its high, take profits.
I am expecting a short term correction after breaking out of:

1) previous resistance - 4413
2)inverted head and shoulder pattern - target: 5095 (695 points); however, the pattern is too big to be deemed accurate so the index would either fall short or overshoot the target;
bulls are hoping to overshoot the target so everybody would be happy.

Breakout seems legit as the accompanying volume is exceptionally high(7+Bil TO) today
As for the short term correction, I am hoping for a shallow one so there would be more steam for the next leg.

Index weekly:

Breakout(new high) entries

BDO : 63.30
URC : 44.65
PCOR : 19.24
PCOR: Correction to 14.78 before continuing?

Wednesday, June 29, 2011

I am surprised that AGI is still holding up at current levels but looks like 11/50SMA are holding up. Short if the closing tomorrow is lower than today's close.

MPP of ICT held. If selling continues to prevent the price from breaking past this level, expect a breakdown.

Thursday, June 23, 2011

Calculated breakout entry for PX is at 21.01 but RSI is not confirming any breakout. Pretty wide trading range 18-21 for the mean time.

Calculated breakout entry for AT is at 20.75. But at the current rate of ascent, the price appears to be the short term peak. Look to position at the second gap(19-19.24).

Wednesday, June 22, 2011

LC/B barely moved today while AT and PX jumped with 4+% gains. I think PX will enter a parabolic run when it closes higher than 21.75.

Issues that are lingering just above 50SMA are ICT, MBT. NIKL appears to be forming a base.

The index appears to be at its immediate resistance(50SMA+50RSI).

Not much interesting moves on the PSE so I am still practicing on trading FX(EURUSD and XAUGLD pairs) on my free time. I still get frustrated from time to time as I continually forgets my basic trading rules :))

Forex trading appears to be more promising nonetheless if done properly. There would be no more need to wait for quarterly earnings report.

I asked around again the local forums with regards to forex trading. Let's see who would even bother answering :))

I think Gold($GOLD) is preparing to challenge the 1574 levels again in the short term. Think long!


Tuesday, June 21, 2011

TEL: Divergence

Divergence: Deal or no deal?


The only thing that disturbs me with TEL is the flat price action in between divergences, inclining me to believe this action as a fake one.


I am having trouble seeing what's real with all the superficial closings last week.

No meaningful moves with LC/B while most of the oversold issues rallied today.
LC is being slightly bearish on the 5-min chart while LCB is slightly bullish on the same time frame.
This might suggest further consolidation in the short term. Still waiting for a rally with huge range/bearish RSI divergence.

AT broke and closed above its box resistance @18, looking forward to 19.50 as a short term target.

MEG rallied(DCB?) off its MS1 today. Short term target @2.14 levels(MPP and 50EMA).

Most of the gainers today, I cannot read.

Started another FX demo account with US$3k. Applying proper stops and money management now after turning a winning trade with the previous account into a loser.

Monday, June 20, 2011

I think I kind of getting it not to keep positions overnight. From a $700 gain from the long position in EUR-USD last Friday that turned into a $200 loss today as the initial stop loss was hit, I feel disheartened. I probably should have placed a stop before going away. This sucks. I'll never leave any open position overnight the next time around. /wrist

Friday, June 17, 2011

142 is selling the market down again through BDO -5.73%, BPI -4.34%, GLO -4.20%,
and TEL -2.57% while they bought up AP +5.70%, SCC +7.76%, and CEB 5.73%.

LC was a little bearish but no actual divergence while LCB is bullish both on the 5-min chart.

Thursday, June 16, 2011

Trailing stop got hit on the EUR-USD short position with 60 pip gain.

Currently looking for another short entry on the pair.

Positions in LC/B got spared from the huge drop in the western markets. Hoping for a better exit now.

Wednesday, June 15, 2011

EUR-USD: Short position


Sold EUR earlier today but my trailing stop got hit so I am trying to optimize my stops/trailing now plus the optimal position size. Trading on the bigger time frame gave better returns(pip per se).

Majority of my "winning trades" before came from the short side. Majority of my losses are from choppy movements in the 10-sec frame. Thanks to my uberly stupid position sizing, my losses are greater than my winnings lol.

It really feels easier to make trades on the short side.

Currently focusing on trading 1 pair only which is EUR-USD.
Sold EUR-USD again earlier on bear flag breakout. Let's see how this one pans out.


*Doji candles seems to be working well on the 50EMA.

Trial by Fire

Currently short on EUR-USD, reduced size of the position and applied a suitable stop loss and trailing stops. I probably shorted a little higher, no thanks to my stupid position sizing and stop loss. Now trading on the 15-minute chart with the same triple EMA crossovers.
Caught the entire leg of LCB upswing. Looking to take profits already. Hopefully it registers a new high so I can exit higher. What a pig lol.

10% gain in LCB today vs 1.92% gain in PX(technically 3.84% since it's on margin).

Tuesday, June 14, 2011

$1000 feels a little too small for FX?

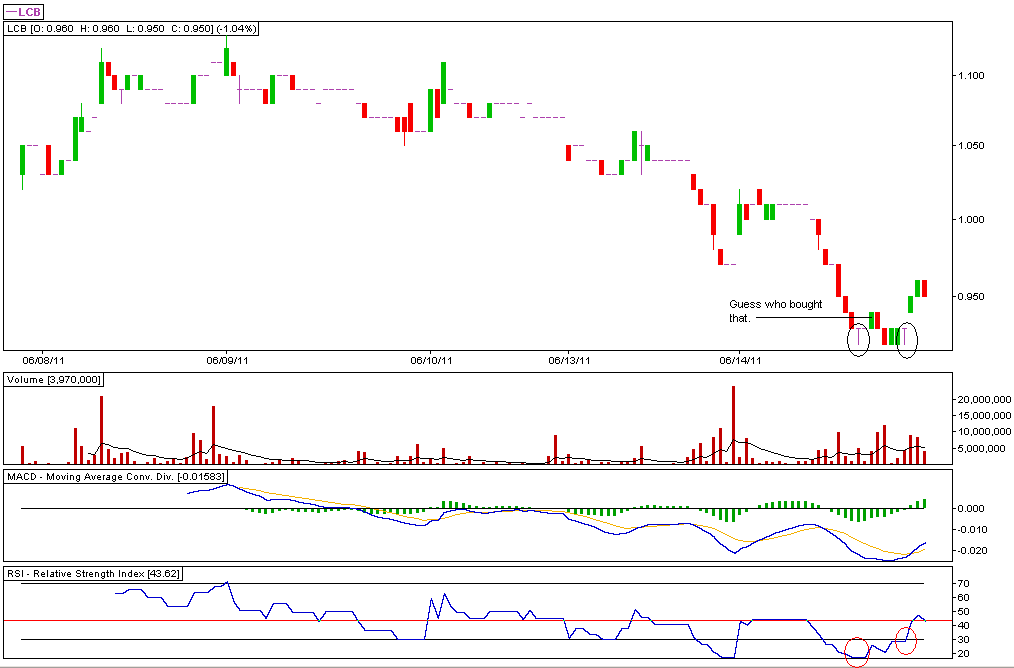
LCB

Divergence on the 5-minute chart


I chose LCB over LC because it is lighter.
LC bounced off MPP.

Let's see if this move is sustainable throughout the week.
Bullish divergence on the 5-min chart of LCB. Got in @0.94. Let's see if this is sustainable up til closing.
Stopped out in PX.
Starting my new FX demo account with lower capital ($1000) to make it feel more "real", using maxed margin taking only 1 position.

Cna you imagine I still get impatient even though I am already trading on the 10-sec chart. I feel ridiculous lol.

PX

Bottom on the 5-min trend?

LC

Divergence confirmed?

Monday, June 13, 2011

Trading update and FX: Trial by fire.

Nothing much to post today as I was at school earlier and was only able to trade by 10:30am. PX/LC/LCB has already drop in within the levels of my expectations(+/-10%) courtesy of the bearish divergence on the daily chart so the issues could rebound anytime, most likely when DOW/GOLD rebounds.

I tried to scalp earlier today despite of the crappy market this noon. Got my hands some papercut trying to trade XAU-USD and USD-CHF with my trend/volatility system despite of both being range bound. So I lost the $400 that I gain in EUR-USD the last time which I am trying to recuperate right now on EUR-USD again and I kinda recovered half of what's lost already.

I think it's alot better to trade EUR-USD than GOLD and CHF as I always have terrible fills in both GOLD and CHF.

Somehow, it feels like it's alot easier to trade on the short side?

Candlesticks doesn't seem to work on the 10-sec chart...

Maybe it's just my imagination.

Next time I'll make another demo account with smaller capital($1000) as I don't know if I can handle the $5000 account with maxed leverage on actual trading. Right now, I am trading the whole account in 1 position only with maxed leverage with a very tight stop.


*Ninja edit: My take profits point didn't get hit just now @1.4350 in my short position (EUR-USD).
PX gap filled pala.
Out of my first class. Ouch PX!

Friday, June 10, 2011

FX: Trial by Fire

Day 1: -3600$$ (US%100k - Different account)
Day 2: -400$$ (US$5000 - Different account)
Day 3: +395$$ (US$5000 - Same account: D2 )
Day 4: -740%% (US$5000 - Same account: D2 )

Forex demo account : Trial by Fire.

I have been thinking really hard on what I am doing wrong in the forex the past 2 days since I lost around US$3600 the first time I tried.

Day 1

The first system that I tried was using was a 9-50 EMA crossover on a 30-sec chart, which takes both long and short position. At first I was impressed as it produced profits on both sides. But when I checked my trades, the crossover produced only a maximum of 8 pips which kinda sucks since I had been reading other people's disclosures of minimum of 100 pips. Then the choppy session came. The losses from the sideways session piled up together with the 8 pip gain that I didn't take, I was devastated and my head started to spin so I decided to take one final trade before calling it quits for the day. I went short on GOLD and slept.

The next day it had a 2.45. That's 2450 pips if I'm reading it right, right? I closed it because it was a half-meant trade so I am counting that one on pure dumb luck.

Lost 3600USD using the system in a 100k account(3.6% of capital).

**No idea on how pips work, where to put the stop loss, trailing stops, and proper position size to maximize the leverage. I didn't even know how buy/sell stops work lol.

Day 2

So I made a new account and put a more reasonable and realistic amount that I can actually put up. This time I used the triple EMA crossover (9-18-50). It also takes both sides of the trade. Disappointingly, it lost more than it won so I decided abandon it and used another system(buy above high-sell below low) which also failed miserably. lol.

Anyway, I started asking myself why the triple EMA crossover didn't work in FX while it worked and showed profitable results in the stock market. Then it got me thinking that I have to be on the right side of the market. With that in mind I decided to "zoom out" and check for 50EMA in longer time frames and trade with the 50EMA trend.
Got really tired so I decided to call it quits.

Lost 400USD using both systems in a 5000USD account(8% of capital).

Lesson: Trade with the trade. Don't take unneccessary trades. Sit tight when winning and set trailing stops. Don't be too eager to trade/wait for the right setup.

Day 3

I probably had the best trade today so far as I was able to gain $$50 above my starting capital haha. I lost it anyway when I started doing what I was doing in my first 2 days of FX trading. After losing the $$50 that I gained, I lost another $200 when I deviated from today's trading plan. After I reconized my own stupidity, I decided to FINALLY follow my trading plan LOL. So, I took the next trade and I was up by $200!!! But then I got really greedy I didn't put up a trailing stop! LOL!

So what do you expect from a pig other than get slaughtered?

Lesson: Don't be a pig and set trailing stops. Trade with the trend.

Let's see if I can break-even tonight. Currently short on EUR/USD.

*Trade setups. Trade with trend. Trade with trailing stops.
**I also tried selling lower and buying higher but both failed miserably. I probably should use them with the 50EMA.

***Currently using the triple EMA crossover in 1-minute chart + 50EMA on the 30-minute chart. Entry points are more often retested than not.
It took over an hour to fix the connection with COL. Average of the entire position in PX is down by 5%. My my. I'll probably just wait for the gap to be filled.

Thursday, June 9, 2011

LC

Bullish divergence is confirmed once price advances tomorrow.

PX

Bullish divergence is confirmed once price advances tomorrow.

Flat day. No more cash. I'm just going to play with my demo account. I'll try not to lose as much as yesterday lol.
Nope, no 9EMA bounce for PX today. 18EMA?
Lost a little less than 4Gs on my forex demo account. This is way alot harder than I thought lol.

Wednesday, June 8, 2011

I dunno how to apply my usual stop loss system(stocks) in fx lol
All positions in LC are up.

2 positions in PX are up, 3 positions are down. Hoping for a bounce at the 9EMA.
LCB new high. LC still lagging behind.
LCB is 11 centavos away from its pennant/flag target.
LC is still 24 centavos away from its pennant/flag target.

AGI: Short term rally targets

AGI initial short term target hit 10.30(10.31).

Next 10.63

Best case 11.10

Tuesday, June 7, 2011

GERI

Just another case of bearish/bullish RSI divergence on the 5-minute chart

AGI

The reasons why I didn't come scampering to this stock when it gapped down are:

1. Gap down from support.
2. Triple EMA breakdown prior to the gap.
3. Close below 11 as it completes the H&S pattern that formed

Had you faded the gap, the best you could have gotten from the trade is 5.94%. That is if you got the exact low and high of the leg.


However, it appears to be forming a bullish RSI divergence on the daily chart. A close higher than today's closing will confirm the bullish divergence, suggesting a short term rally to 10.31 up to 10.63 and 11.10 as the best case scenario.

It could rally, it could not and I am not willing to place my bet on this one.

Also, the minimum short term target isn't enough to justify the trade so I wouldn't touch this one yet.

I'd wait for a bullish RSI divergence on the weekly charts in the mean time.

To the next trade!

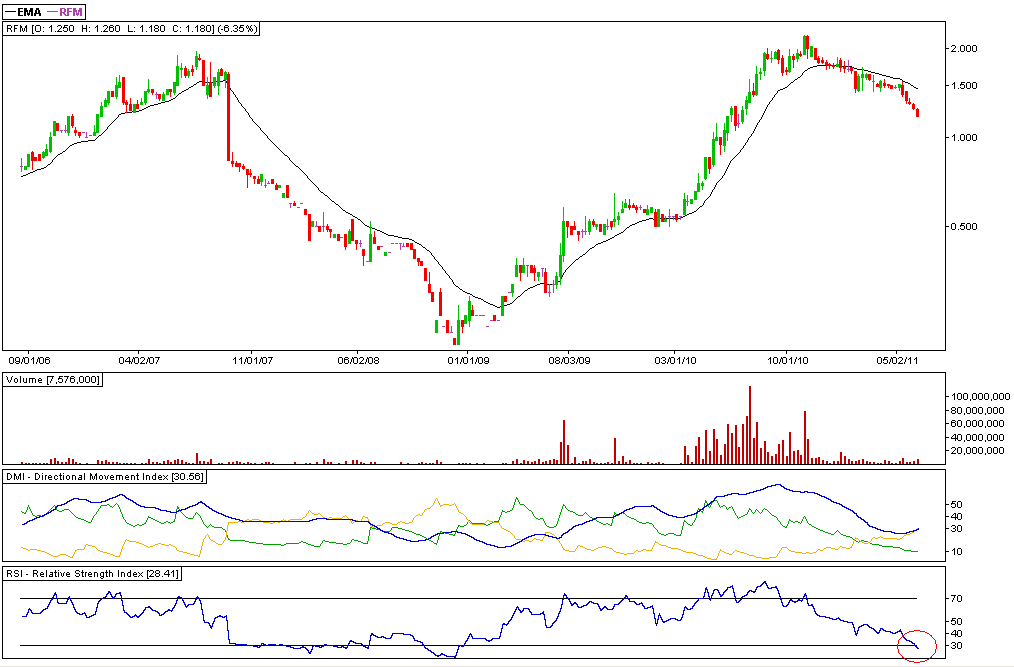
RFM: Capitulation(?)

Daily Chart:

Capitulation? Long black candle with spike in volume suggests panic selling. DMI(ADX) value has also reached the highest in the last six months. RSI value has also reached its lowest in the last six months.


However, despite of observations, I believe that it would be better to watch price action to stabilize first before taking any actions such as bullish divergence on daily and weekly charts and/or sideways breakout.

Weekly Chart:


RSI has dropped below 30 on the weekly chart suggesting a parabolic drop is probably in the works.

Trading plan: Watch the circus. Sell rallies to 20EMA.
Increased position in PX. Average of PX holdings are now stuck at the middle of the tight trading range. Target still intact, just waiting for the breakout to happen.

LC bounced off support but met resistance at its WPP. LCB hardly retraced to its breakout point. LCB has better price action.

Attempting to predict LC top for tomorrow: 0.97.

URC seems to be forming a flag/pennant. Buying pressure appears to be building up.

AGI forming a bullish divergence on the daily chart? If yes then it could probably yield a 10% gain from its new trough(none as of this writing).

Not much issue to trade with, except for mining issues and other selected issues.

Didn't touch PWR, still unfamiliar with parabolic moves. Too scared to be the one left holding the empty bag.

P1 cash div in DMC, ex-date on the 10th of June. Yield is 2.41% using the recent close(41.40).

I'm liking the 5-minute divergences. I still need more practice!
MEG looks ok. Buy if close > 2.05? Short term target 2.20.
There goes the cross in PX.

LC

Bullish divergence on the 5-minute chart


Since the last bearish divergence produced a 10% drop, I am going to assume that this bullish divergence will produce a 10% gain(at most) with an average of 4.5% gain for the mean time.

Monday, June 6, 2011

LCB


Yum?

Or wait for another bullish divergence on support(0.94)/20EMA?

Buy stop in LC @0.89 didn't get hit today.

Juicy bullish divergence in LCB?

New positions in PX did pretty okay as PX close higher @20.80. It was only pushed up on the closing though. Still have unfilled buying orders.
Add on 20EMA pullback(daily and/or 5-min)?

Got trapped in LPZ so I decided to close the LPZ position despite the bullish divergence on the 5-min chart. Daily RSI just made another lower low, enough to warrant a sell, so I sold it for a small loss. Proceeds were used to buy PX.

AGI seems to be forming a bullish divergence. The only reason why one should avoid this is because it is in a steady downtrend.

It feels like 5-min divergences are pretty good in predicting intraday/short term swings. I only need to know where to take profits.

Still keeping my eyes on mining/momentum.
LC buy stop will probably get hit if it closes @0.89. Buy stop @0.89.

PX

5 minute chart

Friday, June 3, 2011

Breakout! - Not!

LC daily chart:


RSI is the give away here. But with LCB:


RSI looks pretty strong as it broke past 70!
Volume is very good too!

WHY?????!!! /wrist


*On a personal note, weekly charts appears to be bullish.
My assumption with 5/10 min divergences(tested on LC) is a bit off by 0.01(1 fluc) as it closed lower at 0.91.

Does it really work that way or I just got lucky today? Need more test.

PX bounced off WPP/MR2(20) today but it looks like it is going to open lower by next week.

LPZ broke down from its 5-min trend line confirmed by RSI. Spread is still pretty wide. I should have placed my sell order @6.58 today. Looks like I'm going to be stuck in a triangle.
PX bounced off WPP/MR2(20). Looking to open higher next week?

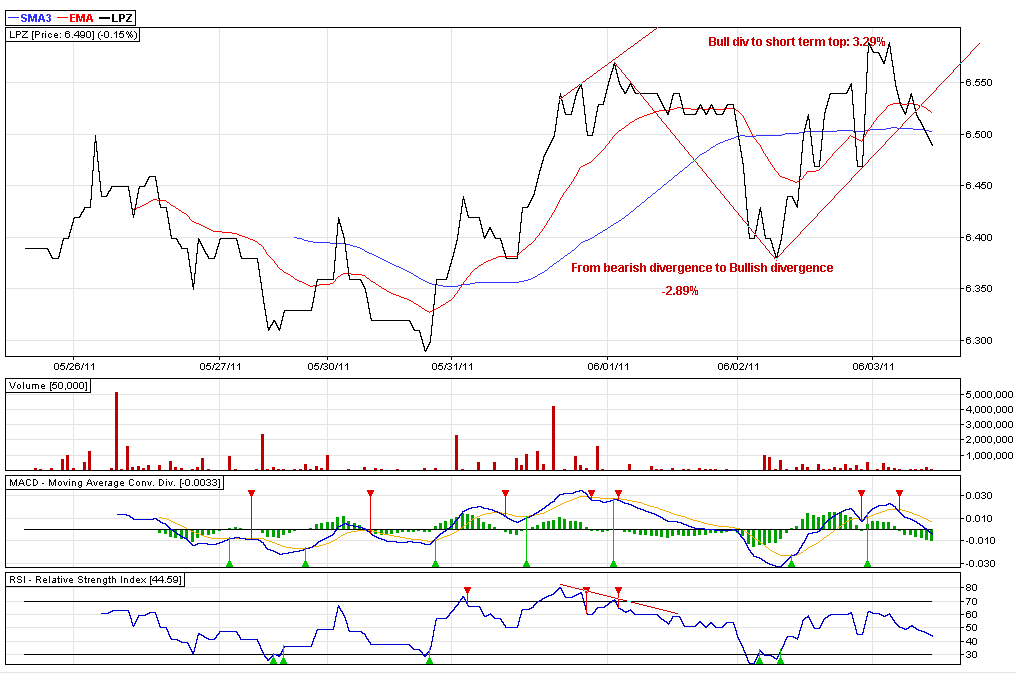
LPZ

5-minute chart: Bearish divergence - bullish divergence:

LC: Bearish divergence on 5-min chart

Will you drop?

LC

So I asked around the local "trading" forum about how many points does a bearish divergence found in 5/10 min chart costs. So far, nobody has replied yet. It appears like there are less people trading using intraday charts.

I'll just make my own research then.

LC 5-min chart:


How low will you go?

Thursday, June 2, 2011

NIKL

Bullish divergence?

Chasing momentum

Sold 25% of LPZ position @ 6.54 for a mere 1% profit.
Sold all URC for commision loss + 0.4% loss.

Proceeds from both position were used to buy back PX. Calculated breakout entry is 21.15.

LPZ was pushed up at the closing, giving my position some superficial gain.

LC closed on high. Second day after breaking out.

LCB broke past 1 already.

Breakout buy seems to be working pretty nice.

"Buy stop",(calculated from last month's MPP,)for MER @257 was "hit" today. Unfortunately, I wasn't really watching it. It looks good now nonetheless as volatility and trading range is above average.

I was scanning the market last night for possible trades using RMO.
It gave buy "above-high" signals for Industrial and Mining-O indexes.
Same signals were found in LC and PX. On the other hand, I was thinking what possible play from the Industrial index. It never came to me that MER is under the Industrial index. Stupid me.

The All-shares index was also given by the system a buy-above-high signal.
A broad-base rally perhaps?

By the way, I heard that the US and EUR markets broke pretty bad last night.

LPZ: 5 Min Chart


Looks like bullish divergence to me.

Wednesday, June 1, 2011

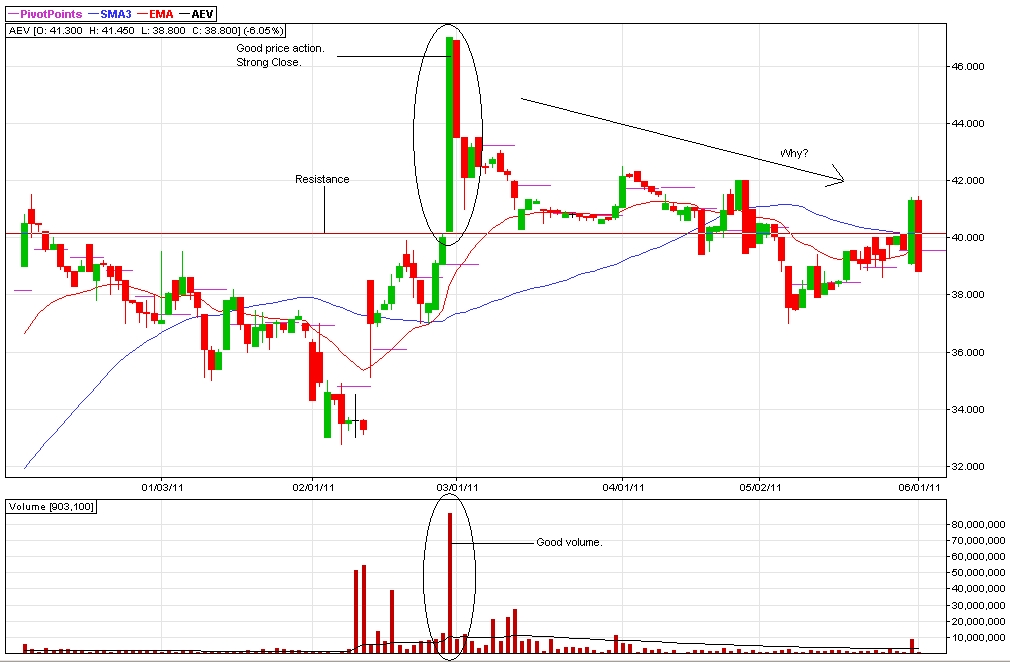
Breakouts and volume

It has been customary that a breakout needs a strong close accompanied by good volume.

But how about this:


So is it really worth it to wait for breakouts with "very good" volume?
Would be buying on breakout on "mediocre" volume better?

GERI appears to be an exception to the group as the fundamental reason why it was rising was pretty obvious to the public.

The hell is wrong with ICT and AEV.

Almost ceiling by PWR. No sellers at ceiling price though, probably trying to avoid investigation if price hits the ceiling.

AGI gap almost filled.

AP range trade.

DMC moving to fill the gap?

GERI closed at resistance level?

JGS bounced off 20EMA.

LC second day closed above 0.88. Breakout buy if close >0.89.

LCB look for minor pullback to 0.94.

MA momentum picking up despite 126 sells?

MEG look for a double bottom/failure swing low setup.

MER range trade? Wasn't really watching it but price spread probably is wide.
Place buy stop 240(?) and sell @250(?).

RFM is still on a steady downtrend. Looking forward to a steep drop.

SMC RSI buy signal today. Resistance @120?

SMDC range trade?

URC moving in boxes? If yes then close > 44, target = 46.

Tuesday, May 31, 2011

Market closed lower courtesy of TEL and ICT.

TEL looks ok for range trading but range is pretty small too (+/- 5%).
Today's action looks overly bearish.

ICT. Well, I dunno what's going on here. The MSCI inclusion issue perhaps? Looks like range trading too. 4% up, 4% down. Anyway, I am trading issues with more upside bias.
Sold my position in LC with the highest aep @0.86. LC closed today @0.89. =(
Proceeds used to buy LPZ. Position in now up from break-even level.
Free cash used to buy URC. Position is also up.

My previous analysis for LC is if closing price is higher than 0.88, it could propel the prices somewhere around 0.98. However, 121(MACQ) seems to pushed the price up at the closing. Breakout entry also says buy if close is higher than 0.89. Let's see.

LCB second day close above previous high(0.94). Breakout entry says buy if close is higher than 0.94.

Missed CEB. Today is probably the start of a new upswing. Daily up, weekly up. No reason not to go long.

Volatility back in BEL and GERI? LR is the weakest among the group.

Volatility is also back in AEV. Not really watching them lately. My attention was range trading mining issues.

Range trade AP. Range is ok but a little tight though. +/- 6%. Drop back to 28 can?

Look for a pullback-entry in EDC? 50EMA pullback perhaps?

Good thing I sold PX yesterday after that ugly-as-fuck candle pattern. Let's see if 20 holds as support. Gap @19.36-19.26. Gap filled: Good. Gap not filled: Better.

Monday, May 30, 2011

LPZ looks tempting. DOji resting on 20 EMA.
Took profits on PX. Today's price action sucked. Looking to swing trade in the future.

Saturday, May 28, 2011

CEB

My initial reading suggests a pullback to around 90(weekly basis) after breaking out to warrant a buy although I wasn't expecting it to drop up up to the current level.

But it did:


It retraced to 61.8% Fib levels. Nonetheless, it provides a relatively good short term upside at current levels up to the recent high of 98.

All we need now is positive(weekly/daily) momentum.

Confirmation of move this week:


Even if this is just an A-B-C correction(in a downtrend), you'd still have one profitable leg/trade.

Friday, May 27, 2011

Market Cycle


*For reference only.

Universal Robina Corp (URC)

One crazy idea:


It was suggested that the wave 3 is the longest wave. If I recall it correctly, wave 3 is like x2-x3 of wave 1.

Please take note that I do not practice Elliot wave theory, thus this is just one crazy idea that I have.

Trader's Toolbox: Reversals

Rules to mark a reversal high:

1. The market must make a new high for the last six to eight weeks.
2. The market must close lower than the previous day’s (or week’s) close.
3. The market must reverse the previous day’s (or week’s) action.
-To clarify rule three, the day or week preceding the reversal must have posted a positive close.
4. The market must post follow through action the next day (or week).
-To clarify, the market must close lower on the day (or week) following the reversal.
5. Fifth, the reversal must be accompanied by moderate to high volume. And, finally, the reversal must occur in a terminal (critical) area.


From CLUB.INO.COM. Original post linked on the title.

Philex Mining (PX)

Broke into a new 52-week high (on a Friday).
My calculated breakout buying price is @20.03.

However, RSI is relatively weaker vs price with bearish RSI divergence which are bugging me so I am keeping a tight trailing stop for the meantime. Long white candlestick accompanied by huge volume suggests a short term overly bullish sentiment.


My initial entry is @19.22(1) but I decided to sell 60% of the position(2) that resulted -0.06% of capital as the price of LC that day looked pretty attractive.

Position is now up by 4.65% from adjusted entry price.

Looking closer at the 5-minute chart:


MACD bullish divergence was seen on the 5-minute chart but the price reversed only after RSI divergence.

Crazy juice flowing on the weekly charts:


Pullback after breakout(red circle) from symmetrical triangle pattern with (+/-) 22 as target.
RSI historical resistance 86.

It took 14 weeks to resume its uptrend after breaking out which is kinda hard to time. lol.
Maybe I can (much later on)when I get better in trading.
All positions are up!
Will the property dividend by PX enough to push the prices beyond 20?!

Breakout buy on PX?

I think PX closing higher than 20 is enough to warrant a hold for the meantime.
Bid size got pretty thick today!

I think AP just bounced off from its support @28. Look to take profits @30-32.

Thursday, May 26, 2011

Wednesday, May 25, 2011

Sold(cut-loss) half PX @19.66 earlier today. Remaining position break-even level is now up @20.
Proceeds used to buy additional LC @0.81.
Free cash used to buy additional LC @0.78.
Only 1 losing position in LC, bought @0.85.
I'd probably lighten up somewhere 0.90+ but if this one closes higher than 0.88, I'd probaby hold for the meantime.

AGI broke down/gap down and closed below support @11.
DMI sell signal on daily and weekly chart.
wRSI broke down.
Triple EMA breakdown.
Pattern breakdown target: 9.12.
Medium term support: 10.

AP weekly 50MA/Pattern support: 27.
wRSI broke support.

AT Range trade. Trading range 16-18. Possible trend candidate. wMACD Buy signal.

CMT support 1.20.

LCB possible doji setup.

LR possible doji setup.

MA gap support @0.039 held(?)

MER MPP possible penetration. Buy stop @257.

PX weekly reversal pattern. wRSI sell signal. Watch price movement at wRSI support.

SMDC range trade. Trading range 8.50-9.50.

SMPH breakout candidate. Normal resistance @12. Trading range 11.50-12.

URC WPP buy signal.


PSEi is bearish. New RSI low but index is still not making new lows.
All shares index looks like holding up(RSI support).
Financial sector is forming successive lower RSI highs(bearish divergence). DMI sell signal today.
Holding sector is forming successive lower RSI highs(bearish divergence) and currently trending down but trend strength is starting to pick up.
Industrial sector is holding up(RSI support) but currently trending down and trend strength is starting to pick up.
Mining sector is holding up(RSI support) with a possible short term reversal play(doji setup).
Property sector appears to be in a weak downtrend.
Service sector appears to be in a weak downtrend.

LC

Bullish divergence on 5-min chart:


Or I am probably just hallucinating lol
Can the bears push AGI down to 10?

Tuesday, May 24, 2011

FGEN

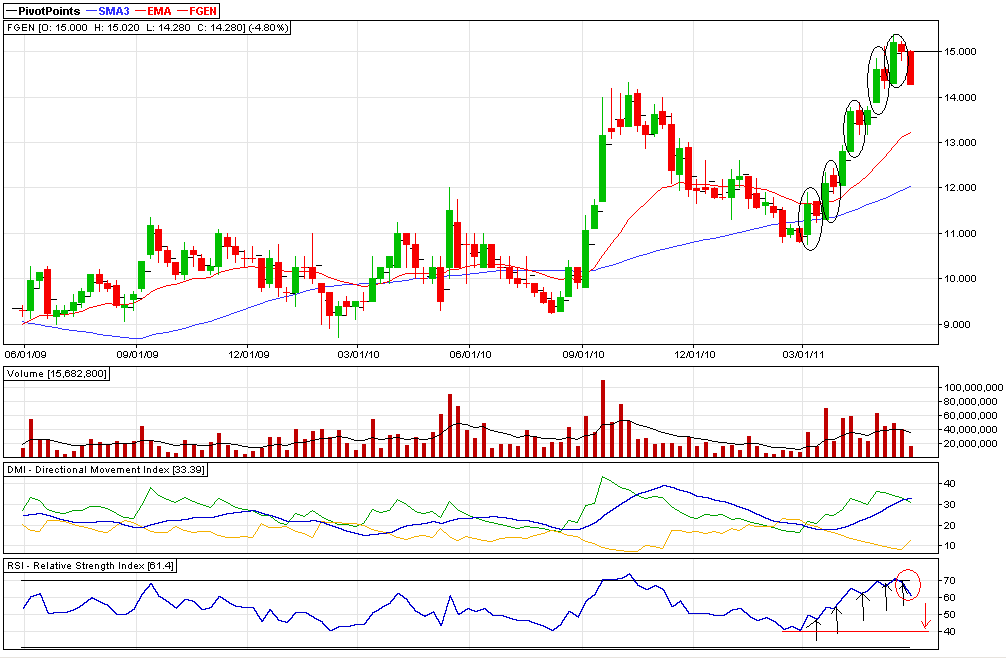
Good thing I checked FGEN's weekly chart despite the urge to buy after the four consistent pattern it was showing:


I think it's better to wait for weekly RSI 40 for the mean time.

I wasn't expecting the gap down today though.
Got stopped out in FLI @1.21.

I really thought that the 10-min downtrend in LC is about to end when it went the other way around today so I decided to place a barat bid @0.78 which didn't get hit today.
121 bought up alot of shares yesterday @0.85. 121 sold alot of share today @0.83.

I'd probably add some in PX tomorrow if it starts recovering by then.

Finally some volatility in AGI! I am really tempted to buy some earlier but I didn't. I would be waiting for a confirmation tomorrow but if AGI drops to 10.50 levels, I think I would jump on it. Bullish divergence on the 10-min chart suggests a short term bottom is just around the corner.

Or place a buy stop in BEL? Range looks pretty good and can be traded.

Monday, May 23, 2011

Today was rather boring although I think today would have provided some good entries to certain issues.

Issues that I am looking at this week are AT/BEL - range trading, PX/LC/B/URC - trending with LC/B/URC completing a 1-2-3 pullback setup and finally CEB for a pullback after a breakout setup.

I think LC needs to close higher than 0.88 to continue heading up.

Hopefully, CEB closes somewhere @90 this week to confirm my theory.

I am confused with URC's price movement. I am wondering if today's price action completed it's 1-2-3 pullback today. Lemme see my notes...

No idea what happened to MEG today.

I love small red candles. <3

Sunday, May 22, 2011

Manila Mining (MA)

Sometimes, I don't know if I am just having a bad break or simply being stupid when trading.

Here's one of the reasons why I stopped trading with candlesticks(well I still do trade with doji candles though):


A hammer followed by a bullish engulfing = $$ right? Not this time. Had you traded it that way, you are down by 6% or so in the trade already plus another 6% or so, depending on your position size while waiting for your stop to be hit.

Or maybe, I am doing it all wrong. Perhaps wait for the gap to be filled/position at the gap instead?
I'll toss a coin if I would place a barat bid at 0.036.

Friday, May 20, 2011

I'm betting LC will continue to move sideways to down for another day or two.

Too many sellers in PX @20.


*EDIT: If I am reading LC correctly, it would probably resume heading back up by Tuesday.

Thursday, May 19, 2011

Click here for the original post: http://www.investmentu.com

A Position Sizing Lesson: Why Size Matters to All Investing Greats

By Brian Hunt, Contributing Editor
Tuesday, May 25, 2004: Issue #340

I made four times my money in JDS Uniphase. But I made one mistake with JDS Uniphase: I didn’t put enough money into the trade, and picked up a valuable lesson on position sizing. It was early 2000, near the top of the bubble, and I was getting used to making 100%-plus returns.

Reading a popular investment newsletter, I fell for the hype surrounding another tech stock, LSI Logic but I wouldn’t make the same “mistake” I did with JDS Uniphase.

“If I’m going to make four times my money again, I’m doing it with over half my portfolio,” I thought.

But something awful happened on the way to the bank: Instead of soaring in value and making me rich, LSI Logic tanked. I was out $23,000 – more than I would even spend on a car!

The LSI Logic loss was brutal, and it wasn’t the only stock I lost money on. So I decided to make a big change. I couldn’t lose that kind of money again.

I left the markets for over a year to study to find out what professional investors do that I didn’t do.

Here’s what I learned…

Position Sizing is What the Pros Do that Novices Don’t

I made all kinds of mistakes starting out, like trying to make a quick buck and buying the most popular stocks but the biggest mistake was ignoring position sizing as a powerful investing concept.

It’s amazing how few investors even consider how much money to place into one investment. That’s all position sizing is the part of your investing strategy that tells you “how much” to place into any one investment.

Position sizing provides the answers to these questions:

  • Should you place 10% of your money into one stock?
  • How about 50% of your money?

What All Great Traders Have in Common

After taking several big losses in my account, I decided to learn from the greats. I read a book called Market Wizards, and discovered the world’s most successful investors used position sizing by putting only a tiny portion of their money (generally 1-2%) at risk on one idea.

I then learned the specifics of position sizing from the book, Trade Your Way To Financial Freedom, by Dr. Van K. Tharp. After studying thousands of successful traders, Dr. Tharp learned that every trader making millions in the market is fanatical about using position sizing to control risk.

Here’s How You Can Use Position Sizing in Your Own Portfolio

Let’s say you have $100,000 to invest and you’re using the 1% risk model to guide your investments. If you’re using a 25% stop loss, you could buy $4,000 worth of stock and risk $1,000 ($1,000 is 1% of $100,000).

In the example above, you placed 4% of your portfolio into the stock and set a 25% stop – risking just $1,000 of your money (since $1,000 is 25% of $4,000).

Some investors use even tighter stops, in the 10%-15% range.

If you’re using the 1% risk model with a 10% stop loss, you could buy $10,000 worth of stock. You have the same dollar amount at risk ($1,000) as the first example – but you’re allowing the stock less room to go down before you sell.

Now I use smart position sizing – and I never worry about taking big losses like I did with LSI Logic. Take a look at your portfolio today and make sure you know “how much” you have at risk. That way you’ll be prepared regardless of what happens with any one position.
Breakout buy entry

(high+close)/2 > Previous high = buy

Who killed Momentum?


That's who.

FLI's annoying little sucker. Damn.
40 Million wall @ 0.93. Damn.
LC looking to gap up today. yikes

Wednesday, May 18, 2011

Finance Manila: Trading Systems, Methods & Resources

Added a new link:

Trading Systems, Methods & Resources from Finance Manila (financemanila.net).

Lots of stuff to learn in the thread. Too bad it isn't sticky-ed on FM so I'll be keeping a link for a more direct access instead of digging it from the grave. Worth every time spent reading when one needs guidance.

Haters gonna hate.


If LC is a person, this is what he would probably feel today:


Despite my vow not to go/read forums anymore, I still did as I am bored as hell during trading sessions plus there's really nobody to talk to with regards to stock trading among my friends. Anyway, I am holding LC as my core position now so I frequent the LC thread in Finance Manila.
As I read the thread, I already felt that LC is poised for a heavy correction as majority of the posters are clamoring for a gap up to 1 while others are making calls for it to move to 1.20. As much as I do with everything, I ignored it and moved along. And so the correction came and so the bashers. I think yesterday was the worst day for LC as people started to dig up fundamentals again plus I really felt like bashing my head against the wall too lol.

Today it closed by more than 12%.

I think we can use the forums to use some of our trading decision too. As far as I have observed in the past, when people are clamoring for a gap up, it's time to sell. When people are bashing a certain stock - but with the exception of bash-plenty(is that even correct?) issues - it's time to sell.

Sold JGS for -2% of capital today @26.50 for PX @19.22. I still sold it despite the fact that negative momentum has slowed down/bottomed out already because positive momentum in PX has started to gain already. I am looking for a quick(a week) 10% in PX more or less.

FLI is up! Yay haha. Small position only. "GEO" fund.

DMI buy signal on SCC fyi.

See MA. Today was the confirmation that I was talking about right?
I really like to believe that the sellers in LC got tired selling already this past few days.

Tuesday, May 17, 2011

Manila Mining Corp "A"

I wanted to buy some MA earlier today but I was afraid lol.

Here are the reason's why I wanted to buy it:


RSI is resting at its support with negative ROC flattening out suggesting the correction is over.

Maybe I should have bought since I was feeling afraid lol. Anyway, confirmation of the next move is tomorrow.
Was thinking of selling JGS for a loss earlier today so I placed my sell order @25.85 but I pulled it out when I saw someone bought up to 25.60. Luckily, it closed @26 although still for a loss. I am starting to get traumatized by doji candlesticks at higher end of the trend lol.

Today is probably the worst day for DMC. -11.70% in one day just because it wasn't included in MSCI(unexpected)?

No way in hell for me to catch the move in ICT today. Will it continue to go higher? I have no idea but I hope it fades the gap back to 55 at least. It is trading another all time high though.

Bought some FLI today @1.25. Let's see how things go from here.
LC is breakeven. :((

Trading tools are back. My current system is for trending stocks, which sucks and prone to buy high sell low in ranging markets.