Monday, January 24, 2011

PSEi: Doomsday scenario

As the moons of Mars and Earth align, just kidding.

Possible scenario for PSEi if it completely breaks down from support:


Fire burning on the dance floor

Everybody is running towards the nearest exit.

Previous all time high at 3896 is broken. Next is 3820. Doomsday scenario is happening?
Bullish failure swing on CPM? If yes, bound for a reversal.

Friday, January 21, 2011

Yikes!

Alot of bearish RSI divergences on the weekly charts. PSEi breakdown from support.

Hold your breathe and take the dive at 3800~

Sideways to down.

The PSEi did took the center stage as it lost another 1.38% in today's session, beating western and asian markets with the exception of FTSE. The index has also formed a new lower high and lower low in the short term and it has also broken below the previous low of 3953 - 2 points lower. The market might continue to move sideways in the intermediate term with a downward bias.

It's been a long time since I went red. Yikes.

Got faked out in APC because of the 23M bid at yesterday's closing. It has formed formed bearish candlesticks this week - Falling method followed by a bearish engulfing pattern. However, weekly chart is telling other wise - a long white candlestick and MACD buy signal so the weakness in the daily chart is probably a buy. For the past year, its weekly MACD buy signal works so I am still giving APC a week or two.

Also got faked in AGI. Weekly and daily chart looks very ugly. Should have taken whatever money it gave this week.

ELI started its recovery today. Spinning top after a decline would suggest sellers are losing control. ROC has also started to turn up so I am guessing it's about to advance in the short term. Weekly candlestick is showing a large doji which is bearish. Hopefully it opens higher this week.

NIKL is probably on correction mode.

Waiting for SCC to bounce before getting in. It seems like its going to consolidate in the short term within +/- 200 range.

AP seems to be forming a symmetrical triangle pattern(?). Also forming three stars in the south candle formations and RSI is back on its old support(39.59). Daily signs are mixed so I am not willing to bet on it yet.

Probably best to wait for:
1. Higher high (since it seems like to have formed a higher low already).
2. RSI bounce from 52 in the weekly chart.

All of the stocks that I am currently holding seems to have a normal bid/ask at the closing except NIKL which has 200k shares at 19.98.

RSI buy signal does seem to work on a 5-minute chart if the stock is range trading.
Asian markets down by 1%+. PSEi time to shine?

Thursday, January 20, 2011

Nickel Asia (NIKL)

NIKL Daily Chart


From the looks of it, it is still a long way to go.

The higher end of the IPO price is my long term target.

Lepanto Mining (LC)

LC Daily chart:


The chart says pretty much everything. Possible range trade and trend with it.

Bleeding index is bleeding.

I am proud to say that everything I lost on the basura plays lately(plus the paper loss in ELI), I recovered back today with NIKL. NIKL is the superstar in today's session as it is bucking the Index lately. I completed my initial position in NIKL today. I wanted to add more but I didn't want to pull my average entry up too much. I will be waiting for a correction from 22 before I start adding up again.

Sold CYBR for a loss as my stops are hit during the early morning surge/slide.

APC has started to advance and it has now broke and closed above its resistance at 0.89.

Although ELI is still trading within expectations it is still losing(disappointingly). I'm still keeping it(prolonging losses) as it is somehow forming a bullish candlestick reversal pattern: Three starts in the south. Let's see how it goes in the short term.

Short term trading setup appeared in MEG and SCC. I'll toss a coin which one to trade tomorrow as I still have some cash after buying AGI for another quick range trading.

I'll post the chart of LC later as I couldn't get the clearance to trade it because of "moral issues".

The index lost another 33 points today. This suggests that the selling pressure is easing up and we are just about 6 points higher from the psychological support at 4k.
Let's see how things go tomorrow.

Wednesday, January 19, 2011

Reminder for the whole year

Always stay with strength.

Price movements make news, not the other way around.

Now, go look for a strong stock!~

*Only problem now is I am seeing alot of bearish RSI divergences on most of the stocks that I am currently monitoring. Most of them could still advance but only in the short term.

**Western markets are dropping btw.

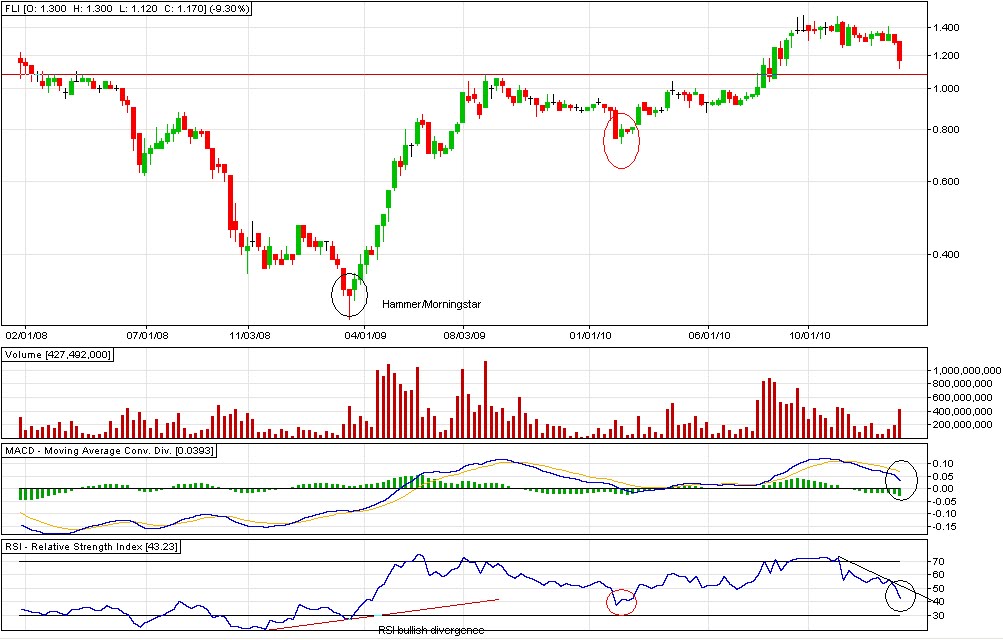
Filinvest Land (FLI) and Megaworld Corp (MEG)

FLI weekly chart:


The setup that I will be looking for before putting up position in FLI is a setup similar with the red circle, an sign of recovery in RSI after the huge drop pointed out by the bearish divergence in RSI.

We already have the huge drop in play. Waiting for sign of recovery. Profit taking would be somewhere at 53 RSI.

MEG weekly chart:


Same game plan with FLI. RSI 35 would seem to be a good place to start catching falling knives. Looks like there is still possible downside in the short term.

Both have hammer candlestick formations. However, I have bad experiences with red hammers without confirmations so I am still not touching them until signs of recovery.

APC Group Inc (APC)

I know I shouldn't be buying the stock first without studying its chart but I already did bought without proper research so I'll study the next position that I'll be taking.

Anyway I was trying to convince myself that buying APC was right. I think I found one:
*Bad trading habit!

APC 5-Year Weekly Chart:


1. Clearly that the major trend is up.
2. Price is currently trading(resting) at its resistance at 0.89.
3. Fresh MACD buy signal.
4. RSI reading is still not overbought.

With this being said, I might still have a couple of weeks for it to climb up before starting its really loooonnnnggggg consolidation.

Prices are poised to break that 0.89 resistance levels as the current RSI reading neutral(not yet overbought).

Once 0.89 is broken, I am expecting it to test the psychological resistance at 1 which I believe will be taken out(biased lol). After breaking the psychological resistance, 1.28 would be the immediate target.

I would close my position if:
1. price meets strong resistance 1.28;
2. weekly RSI hesitates at 75-78.

Strongest weekly RSI reading is 90(1.28).

Now that I found reasons not to be shaken out, I can sleep soundly at night again. :)

I'll study the charts before putting up a trade next time, promise!

Alliance Global Group (AGI)

Here is the weekly line chart of one of my favorite stock to trade - AGI:


*I used line chart to see the formation clearly although the pattern is also visible in the bar and candlestick charts.


It appears that a head and shoulder formation has formed on the weekly charts - which is very hard for me to ignore.

Book definition of head and shoulder pattern:

1. Needs a prior trend to reverse.
2. Left shoulder that marks the high point of the trend.
3. Head forms as a higher peak forms, exceeding the previous high. After peaking, the low of the subsequent decline marks the second point of the neckline. The low of the decline usually breaks the uptrend line, putting the uptrend in jeopardy.
4. Right shoulder forms as price advances from the low of the head which is lower than the head. The decline from the peak of the right shoulder should break the neckline.

5. Neckline forms by connecting the two lows.

Neckline break(most important part of the pattern): The pattern is not complete and the uptrend is not reversed until neckline support is broken. Ideally, this should also occur in a convincing manner, with an expansion in volume

6. Once the support(neckline) is broken, it would now turn into the resistance level. Sometimes, but certainly not always, the price will return to the support break, and offer a second chance to sell.

7. Price target is projected by measuring the top of the head to the neckline. The distance is subtracted from the neckline to reach a price target. However, the price target should only serve as a rough guide. Other factors like previous support levels, Fibonacci retracements, or long-term moving averages should also be considered.


AGI Chart Analysis:

1. Check.
2. Check.
3. Check.
4. Check.
5. The two lows(green circles) are pointing at 11 as the neckline. Price breaking and closing below 11 would complete the pattern.

Initial target after breakdown: 9.04 (9)
Resistance after breaking down: 11

Will it break the support? RSI reading gives the clue on possible price movements in the short term.

Tampons for the bleeding.

The selling eased out in today session, dropping lower by 33 points in comparison to yesterday's 76 point drop. It feels like we are going to find a higher low tomorrow.

The index looks like range trading from 4000-4200 levels. I think I just got my wish granted. Hopefully, index issues provide a significant range to trade.

NIKL, the current star of my portfolio, has finally broken out convincingly out of its previous high. It has also broke its psychological resistance at P20 and it is now trading at its all time high.

I put on additional position in NIKL today(+30% of my current position) and I am still not done putting up the whole position.

My position in APC has started to recover today and looks like there would be continuation. If P1 is taken out tomorrow, I believe it would be safe to assume that it will continue to advance further in the short term as suggested by RSI.

Positions in CYBR and ELI are both bleeding today. ELI tried to fill the gap today.
Buying opportunity on CYBR tomorrow(?).

My timing in my recent positions in APC, CYBR, and ELI is terrible. Position sizing is saving me though.

It feels like something is brewing in MER but still no guts to buy. I would probably trade it once it break 300.

SMC filled the small gap at 160-162 last December 28, 2010. Resistance at 189.
Range trade?

I'm going heavy on mining. There is this one mining issue that I have been monitoring secretly and looks like it is also going to break its most recent high. It is a highly despised stock but it is quietly trending up.

Are people still fearful or superman effect has started to surface?

*Buy at the closing on red days and sell on panic buying days on third liners?

Tuesday, January 18, 2011

Basura Plays Update

APC:


Formed a lower peak after a double top.

*Should have waited to break the double top before buying?
Possible support at 0.80.

Dark cloud cover candle on daily charts.
No RSI bearish divergence.
Normal correction.

ELI:


Formed a lower peak followed by an accelerated break down of the uptrend line.

*Should have waited for a sign of recovery before buying?

Possible Support at 0.70
Dark cloud cover on daily chart.
Bearish RSI divergence on the daily price.


SINO:


Formed a lower peak followed by accelerated decline but found(?) support at 0.43.
Buy if 0.45 is taken out.

Dark cloud cover candle on daily chart.
Bearish RSI divergence on the daily price.


*Note to self: Buy at the closing on red days and sell on panic buying days?

Stop the bleeding.

The market lost 75 points in today's trading. Major losers are led today MEG, MBT, MER and SM.

Bought APC and ELI today. Terrible timing I say as they both end up with paper losses. Good thing I only risked 1% on both position. Still doing it the wrong way. Anyway, I'm still going to try to learn how to trade them.

I closed my position in MBT at 64.40 at a loss. I closed my position in AGI at 12.02.

I thought I was seeing a falling method candlestick formation plus bearish RSI divergence in CYBR so I was really skeptical with it.

AP is looking to move sideways with downward bias(?).

Charts for the third line plays later as I am having trouble loading the charts. Let me see what I should have done.

Monday, January 17, 2011

Aboitiz Power Corp. (AP)

This is the reason why I am still a little skeptical with AP:


Optimal buying window for AP is when it forms a higher trough.

Basura Plays

The main reason why I fail every time I buy third liners is because I don't know how to trade them properly. From the previous trades that I did, I would usually put up the same size of a position the same way I put in blues and second liners. I also put up the same stop loss point. With the erratic behavior of third liners, my stop always gets hit. I am out of the trade and then stock resumes its movement.

Now to solve my problem, I decided to put up a relative small position in third liners when trading with the same amount of capital at risk.

Position sizing is probably the answer to properly gamble on illiquid stocks.

*Word of caution: I am just trying out this idea and I have no idea if this will work. Please always do your own research before taking up positions. Caveat.

**Currently using the crudest form of technical analysis: Trend lines. No other technical indicator is being used as I find them highly unreliable when day/momentum trading. RSI and MACD bearish/bullish divergences doesn't seem to work in intraday charts as they would work on a daily chart.

(If you have better ideas on how to trade this kind of issues, please let me know, it will be greatly appreciated.)

Okay, moving on, using intraday charts to trade:

APC: Breaking out at .89 should be a buy.


ELI: Consolidating at its high. Range of consolidation is at 0.79 to 0.82.
Buy at 0.79. Buy on breakout(Resistance 0.82). Buy on pull back/bounce to/from resistance at 0.82.


SINO: Broke out of trading range 0.38-0.43. Currently heading for correction and looking to test 0.43. Buy the bounce from 0.43.


SUN: Possibly forming a symmetrical triangle. Buy at 0.58 for anticipation breakout.

Skeptical/Neutral

Sold AP today for coffee money. Still being shaky with AP because I only bought it impulsively. Still wait for it to form a higher trough.

Currently holding AGI, CYBR, MBT and NIKL. I also sold several shares of MBT at 65.20 today because it's being a laggard and to raise funds for a possible trade for this week.

I am pretty much disappointed with the recent movement MBT. Good thing I sold some MBT at break-even as it continued to fall intraday before closing at its low. Right now, NIKL and MBT are cancelling each other out in my port! :))

I am skeptical with AGI's closing today but I still don't have a signal for profit taking. ROC is still poiting towards further advance in the short term.

I am also skeptical with my position in CYBR as I don't know how to trade it properly but since it is now showing profits, I will simply hold on to it in the mean time.

I am still neutral with NIKL as it simply continues to move sideways. ROC is now pointing up so this could probably point out to further advances in the short term.

Still trying to learn how to trade using intraday charts. Currently studying 5 minute charts for timing/day trading(in the future).

So in conclusion, I am still skeptical to neutral with my current positions.

Sunday, January 16, 2011

Philippine Stock Exchange (PCOMP)


Looks like the market is poised to move sideways for the meantime after sliding down big time (as pointed out by the bearish rsi/price divergence) from the recent top at 4400 levels. However, the index seems to be moving higher this coming week as suggested by the strong closing last Friday with RSI seeking to break above 50.

Volume indicators reflect moderate flows of volume into the index indicates mild bullishness in the short to medium term.

Short to medium trend: Sideways to up.
Support: 4000 levels
Resistance: 4300 levels

Breaking and holding up above 4300 levels would suggest the resumption of the uptrend.