Friday, October 29, 2010

Metro Pacific Investments Corp. (MPI)

6-Month Daily Chart


Looks like MPI has finally broke out of its resistance at 4 today, as it broke out of its ascending triangle pattern that formed this past 3 weeks. Immediate target of the said pattern is pointing at 4.42. Expect correction in the short term - 1 week worst case for those waiting for the correction.

I am now expecting it to fill its gap down from 4.70 in the intermediate term.

Personal Disclosure

The market closed slightly higher by 8 points as it continued to move sideways. Hopefully, we breakout of this sideways movement when third quarter earnings reports come out by early November. Technicals still haven't changed so don't expect much from the market.

AP continued to decline today losing 1.44% closing at 27.45. I am expecting it to decline further on Tuesday's session. If it does decline, it should provide a buying window.

DMC looks like its momentum has slowed down, gaining 2.28% today with relatively low volume. Technicals are still not showing any signs of weakness so there could still be more room to the upside.

The "laggard" companies from COL's briefing are one of the best performers in today's session as AGI played catch up, gaining a total of 4.42% after the briefing, closing at 11.34. MPI gained a hefty 4.38% today closing at 4.29 also breaking out of its ascending triangle pattern, gaining a total of 6.87%. DMC gained a total of 6.32% while ICT gained a total of 3.47% closing at 43. Looks like DMC is the fastest horse among them. Let's see how they perform next week!

Finally finished my back-testing on the first part of my trading system. Looks like I still need to refine it further as it only performed 70% during bull market. One thing I observe about it seem like susceptible to whipsaws so I need to add another filter to minimize whipsaws.


AP is currently up by 5.09% in seven trading days.
DMC is currently up by 5.25% in four trading days.

*Earnings report where are you~

Thursday, October 28, 2010

The Replacements

Consunji-led DMCI Holdings, Inc. (DMC), Lopez-led First Gen Corp. (FGEN) and Gokongwei-led JG Summit Holdings, Inc. (JGS) are going to take the places of San Miguel Corp. (SMC), GMA Network, Inc. (GMA7), and Security Bank Corp (SECB) in the index.

Full story here: http://bworldonline.com/main/content.php?id=20235

Personal Disclosure

The market closed 24.38 points lower from yesterday, confirming the further sideways movement in the short term and has also been pointed out of the loss of momentum reflected by the index' MACD and declining rate of change.

The declining rate of change and momentum confirms the further sideways movement in the short term.

No news is bad news.

AP declined for the second day by a total of 20 centavos. Declining rate of change and momentum suggests further correction/consolidation in the short term.

It seems that I was wrong in reading the price movement of DMC as it advanced further today by 4.04%. Rate of change is half-way through from it's previous peak so this current price movement may last by a day or two before heading for correction/consolidation.

One thing that should be a matter of concern in the short term is the divergence of price advances from volume.

I'll still be holding both till they reach my targets. Hopefully, targets are hit by the time the third quarter earnings report comes out.

Couldn't post much as I have been manually "back-testing" my fine-tuned trading system. I was almost done with the first part(bear market) when I suddenly realized that there was an error on the beginning of the testing so I have to re-do everything again. /epicfail

Companies that had their presentation yesterday at Resort World, Riding with the Bulls courtesy of Citiseconline, performed well today as DMC is up by 4.04%, ICT is up by 2.05% and MPI is up by 2.49%. However, AGI remained flat in today's session which I find somewhat ironic as they own Resort World.

AP is currently up by 6.62% in six trading days.
DMC is currently up by 2.91% in three trading days.

*Hold the winning positions as long as possible, keeping trailing stops active.
*Buy what is showing strength.

Tuesday, October 26, 2010

Personal Disclosure

The market closed slightly lower from Friday's session by 7 points (0.17%). If there would be no positive follow through tomorrow, I am expecting the market to continue moving sideways and looking to buy at 4146 levels.

AP still closed higher by 0.18% but the selling was pretty obvious today. Still having divergence in momentum and rate of change suggesting consolidation in the short term.

DMC advanced further today gaining 1.84%. However, weakening momentum and declining rate of change are now suggesting that the price is currently at its peak.

I was second guessing my decision in buying AP before as I might have seen what I wanted to see. It seems like I was not and AP moved considerably in my direction. Same case with DMC. However, it looks like I took the position relatively late as it seem to be trading at the top of its trading channel and still moving sideways.

Anyway, I'll be holding both of them for the meantime till they reach my personal targets.

AP is now up by 7.39% in five days.
DMC is now up by 1.84% in one day.

Monday, October 25, 2010

Long weekend is long.

The market has finally broke the resistance at 4250 after moving sideways this past week. If it is not a false breakout, 4350 is very possible in the short term. However, if it is a false breakout, look into buying within 4146 levels.

AP continued to advance last session gaining 3.90%, closing at 28. Looks like the gap is going to be filled as momentum is relatively top-ish with declining rate of change. Or it might consolidate for a few days before heading back up. Weekly chart is still pointing up so any weakness in the daily chart should provide buying opportunities with minimal risk.

AGI is poised to head up as suggested by the increasing rate of change and momentum. However, there seems to be a strong selling when it reaches 11.18 levels.

DMC advanced last Friday gaining 5.37% closing at 35.30 and it is still poised to head up further as the rate of change just started to point up. Price movement has also satisfied the buying condition.

MEG continued to consolidate last Friday, barely moved at 2.55 levels after breaking out of its symmetrical triangle formation. Immediate target at 2.90 once it resume its uptrend.

The candlestick of PX last Wednesday was confirmed as a hammer last Friday as it seem to reverse its current price movement in the short term.

AT continued to advance last Friday and it seems like it will have a continuation of its advance up to early this week.

Busy weekend so I didn't get the chance to edit and post charts of previous trades.

I sold AGI last Friday for 1% commission loss after holding it for the eight days and I bought DMC with the proceeds as my buying condition for it was satisfied, plus it looks better than AGI last Friday.

Bought DMC at 35.30, closed at 35.30.
AP is now up by 7.20% in 4 days.

*I increased my position in AP last Wednesday, buying at 25.60 and 25.85 not to average down - after buying at 26.60 - but it simply showed a trade setup.

Thursday, October 21, 2010

Personal Disclosure

The market gained 57.21 points at 4249.17 today, 1.28% higher from yesterday's closing, continuing to move sideways with a support at 4146 and resistance at 4250. Momentum and rate of change are now both pointing up and confirming each other, suggesting that there would be further advance in the short term. If both indicators confirm each other on the weekly charts by next week, the resumption of the uptrend would probably come earlier than I expected.

Top gainers for today are MER, AEV, AP and SMPH while top losers are mostly comprised by third liners.

AGI opened strongly at 11 before it was sold down by MACQUARIE and CLSA, closing at 10.86. Momentum-Rate of change reading right on the money. Today's reading is relatively different as momentum has started to gain strength while rate of change declined further. Resumption of the uptrend would be late this week to early next week.

AP continued to advance further today, gaining 3.65% today closing at 26.95, made a gap up from yesterday's closing. If the gap doesn't get filled tomorrow, immediate target would be at 28.80. Momentum and rate of change are still both pointing up suggesting further advance in the short term and both are still less than half-way from their previous peaks.

MEG would seem to consolidate further in the short term as momentum and rate of change are diverging from each other. Pull backs to 2.40 should provide a good entry. Target would be around 2.90 once it starts to advance (symmetrical triangle target).

DMC did continued to consolidate today. However, despite the diverging momentum and rate of change, it appears to me that it is ready to resume its uptrend as the momentum is starting to gather strength. Buy if price crosses over the 10SMA.

Still confused with PX as the latest candlestick doesn't seen to be confirmed much.

Lost my bet on AT as it advanced further in today's session. It would be safe to assume that it would advance further until next week as both momentum and rate of change are pointing up.

On the other hand, looks like I am right on ORE. Both momentum and rate of change just started to point down (from the peak) suggesting further decline in the short term.

I'll be posting charts of my previous trades later.

AGI is still sitting on commission/tax loss for seven trading days.
AP is now up by 3.18% in 3 days.

*In a relatively choppy market, buy what's showing strength.

Midnight Express

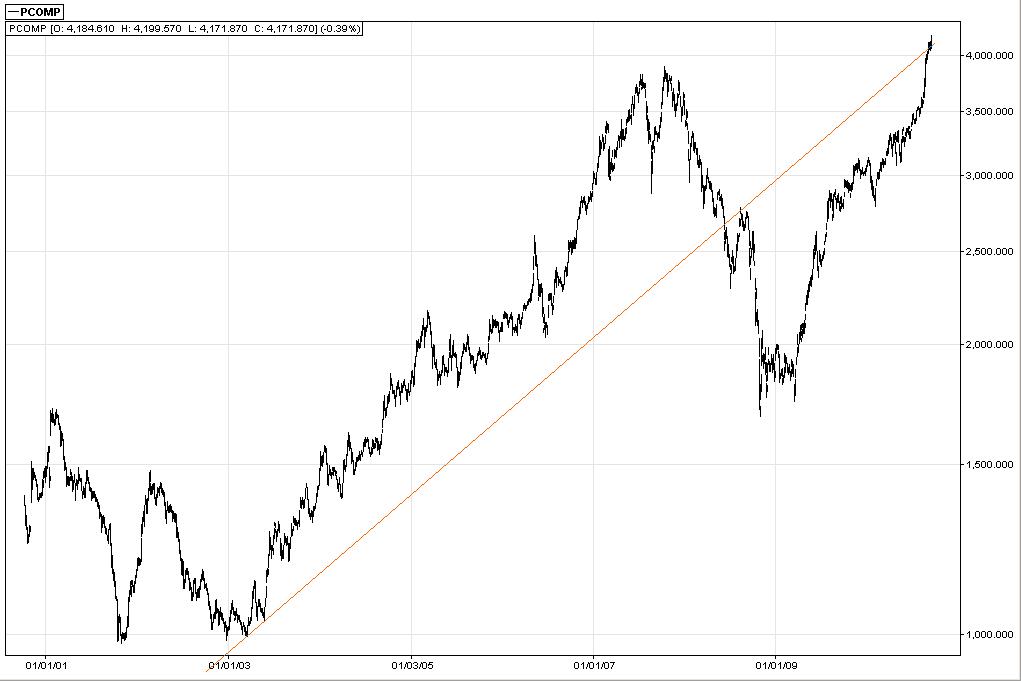
Market closed relatively flat in yesterday's session, dropping 43 points intraday before closing at 4191.96, slightly lower by 0.71 points only. Gainers are mostly comprised by third liners with AT and AEV as an exception while major losers yesterday are third liners too.

Looking at the charts, the index seems to be half way through consolidation, just in time for the third quarter company reports.

AGI seems like its about to resume its uptrend already, but momentum and rate of change are still pointing down so it might still decline tomorrow. However, if it does starts to advance again, tomorrow would be the earliest and early next week would be the worst.

AP bounced off today from support closing by 1.56% higher yesterday. Momentum and rate of change are pointing up already suggesting advances in the short term. Latest candlestick formation also suggests the same. However, I am second guessing my decision as I might have simply saw what I wanted to saw on the charts. Verdict tomorrow!

Looks like I am wrong on assuming buying on breakout on MEG as it opened and closed lower yesterday forming a bearish candlestick. Should the proper play for breakouts is sell the first breakout and buy the second one? 2.40 level is looking to be the next support.

DMC seemed to consolidate further yesterday as it is also being pointed out by momentum diverging from rate of change.

PX recovered today and bounced off its next immediate support at 12.90. However, I am still doubting the candlestick that it formed yesterday as I am unsure if it is a on-neck pattern or a hammer pattern. Only one way to find out, watch its price movement until the end of the week!

I am betting on two to three days consolidation in AT following its advance yesterday, basing it from its previous behavior. Let's see how it'd go.

ORE is one interesting issue. Die hard fans of this stock are jumping out of joy yesterday as it was one of the most active stocks with 3.98% gain. However, is this a reason to be jumping for joy?


Technically speaking, momentum and rate of change are relatively the same with its previous peaks suggesting price decline in the short term. But knowing that it is a jockeyed stock, I hardly doubt that my analysis would be right.

Anyway, I would be try to post a chart of this one since I profited around 30% from ORE before within two weeks.

AGI is sitting on 2.5% net paper loss (commission/tax).
Break-even at 11.15.
Six trading days.

AP is sitting on 0.46% net loss.
Two trading days.


*Sell on the first breakout (of range) and then buy the second break out.

Tuesday, October 19, 2010

Personal Disclosure

The market declined further in today's session losing 23.86 points, closing at 4191.25. Major index gainer today is MEG while major index losers came from the mining sector comprising of LC, LCB, MAB, and PX.

AGI seemed to have found support at current levels. However, both momentum and rate of change are still pointing to further decline in the short term. Weekly chart looks like its half-way through its decline so am expecting it to resume its uptrend late this week or by early next week.

ATR and JPMorgan seems to be accumulating as they are net buyers today with 31M and 1.9M (volume) respectively.

I forgot to post my analysis for MEG if it breaks out of trading range yesterday. It should have been buy on break out of the resistance at 2.55. Anyway, I still missed today's buy on break out for MEG as I left 30 minutes before the market's closing. Any pullbacks near 2.55 levels should provide opportunity to buy with a target of 2.90 from the the symmetrical triangle that it formed on the daily charts.

Major foreign buyer today is MACQUARIE amounting to 21.65M (vol).

Rate of change and momentum are both pointing up suggesting further advance in the short term. MACD is already pointing up and the fast line has crossed above the slow line confirming the continuation of the uptrend.

This is frustrating since I have a position in MEG in COL's virtual tycoon. /sadpanda

AP continued to decline further in today's session, losing 1.92% closing at 25.60. Momentum and rate of change are still both pointing down suggesting further decline in the short term. Declines up to 24.50 should provide buying opportunities with minimal risk.

Major buyers today are MACQUARIE, PEP, and DEUTSCHE.

DMC continued its corrective consolidation today losing only by 0.89%. Momentum and rate of change are diverging from each other suggesting further consolidation in the short term.

Major buyers today are DBP-DAIWA and JPMorgan.

PX broke down today from its support at 14 by more than 3% suggesting further decline in the medium term. Momemtum, rate of change and MACD are all pointing down suggesting the idea of further decline.

Next support at 12.76-12.90 levels.

Looks like I was right about MBT. Too bad I didn't get the "OK" signal to buy it. The only stocks that I have the "OK" sign to buy are: AP, AGI, MEG and DMC.

My position in AGI is still on commision/paper loss.

Monday, October 18, 2010

Personal Disclosure

The market continued to move sideways today, closing lower by 1.24 points. ALI was sold down today again down to 16 before recovering back and closing at 17.30. I now have the notion of buying ALI immediately once it drops by more than 5% for quick money.

AGI continued to decline today, losing by 5 centavos or 0.54%. Rate of change and momentum is still diverging from each other so I am inclined to believe it will continue to decline/consolidate in the short term. Its weekly charts looks like its half-way through its decline so am expecting it to resume its advances late this week or by early next week.

MEG met resistance from its previous high of 2.55 (tweezer top) and started to decline at that point. A bounce from 2.35-2.40 (gap) levels should provide a good entry if it is to resume its uptrend. A bounce from that level would also confirm the symmetrical triangle pattern that formed in its daily chart with a target of 2.90.

However, if it declines further beyond that point, expect a strong support at 2.20 levels and continue to trade the range. Furthermore, if it declines further beyond the 2.35-2.40 (gap) level, the symmetrical triangle pattern would be rendered void and would be replaced by an ascending triangle pattern, with a target of 2.80.

On the other hand, FLI moved sideways with a tighter range from 1.32 to 1.40. A possible symmetrical triangle pattern might also be forming on the charts.

PX dropped by 0.56% today. It is definitely forming a descending triangle pattern. However, as much as I don't like seeing spinning tops on the top of trading ranges as they usually signifies movement reversal in the short term, I pretty much welcome its appearance on the bottom of trading ranges. With a bounce from its current support of 14 should provide a good entry with a tight stop loss right below, with immediate resistance at 15. Breaking above 15 would suggest the end of the short term down trend and it would be resuming its uptrend.

However, if it does break its support at 14, expect immediate support at 12.76-12.90 levels.

I won't be watching RFM for the meantime or until it breaks its resistance at 2 and/or once it gains 10M daily turnover on up-days. Weekly charts seems to be forming rising three method (candlestick pattern) which seems to be pointing at 1.70 level as possible support.

AP started to decline today, losing by 0.76% closing at 26.10. Both momentum and rate of change are pointing down so it seems like it would be declining further in the short term. Pullbacks and rebounds from 24.67 to 25.27 should provide good entry points. Weekly charts are looking relatively weak so I am not expecting it to rebound up til early next week (at best).

DMC would seem to be consolidating in the short term. A bounce from 31-32 levels should provide good entry.

The selling of MBT looks like it was overdone/overly bearish for me. Buy if it advances tomorrow with immediate resistance at 71.92 up to 72.96.

My current position in AGI is still the same; sitting on half of commission/paper loss.

Saturday, October 16, 2010

Personal Disclosure

The market simply moved sideways this week as it closed 17 points - 0.40% lower from yesterday's session, closing at 4216.35. This market behavior would probably last till the next earning reports come in. No news is bad news.

AGI fell by 1.43% in the previous session, closing at 11.02 leaving my position virtually unchanged when I bought it. Divergence in rate of change and momentum is suggesting further corrective consolidation in the short term. Weekly charts is definitely pointing down now.

Of all the property stocks that I've been watching, MEG seems to be the one that showed greater strength among the three. Although it seems like it has peaked already at 2.50. Any rebounds from the support at 2.20 should be bought. Weekly charts also gave a buy signal so any weakness in the daily charts should provide a good buying opportunity. Breaking the previous high at 2.55 would be possible as soon as the MACD starts pointing up.

Not the same case with ALI as selling started to surface at the 18 levels. Bounces from 16.70 levels should provide buying windows with a tight stop right below it. Avoid if it breaks the 16.70 support levels.

FLI behaved like ALI although not as bad. Rebounds from 1.32 support levels should provide buying windows with a tight stop loss right below the entry point.
Avoid if breaks the 1.32 support levels.

PX is make or break at 14. Divergence in momentum and rate of change is suggesting consolidation though.

RFM closed unchanged yesterday. There was a slight loss of momentum although both indicators are still pointing up so the possibility of advancing and retesting the resistance at 2 is possible.

I missed the AP boat! /sadface

DMC is probably the only one I can ride with now for the mean time.

Wednesday, October 13, 2010

Personal Disclosure

The market opened 20 points lower today before gaining 27 points at the end of the session.

AGI gained another 3% today, half-way through my break-even point! Momentum and rate of change is still diverging from each other suggesting consolidation in the short term. Weekly chart is manifesting relative weakness suggesting selling on rallies although it might change if the stock finishes up strongly this week. Pull backs to 10 levels should provide nice buying windows.

RFM, PX, MEG, and ALI also rebounded strongly today.

ALI found solid support on 50-MA. Today could have been the best buying window for this stock, with immediate resistance at 18.42 levels. Very nice candidate for range trading. I am not expecting it to break its previous high at 18.70 in the short term as the MACD reading is still pointing down.

MEG bounced off strongly from its support at 2.20 levels, gaining 4% today. Momentum and rate of change have began to point up suggesting advances in the short term, with immediate resistance at 2.43. Breaking of the immediate resistance would suggest that the uptrend would resume. I highly doubt it though as MACD reading is still pointing down so I am more inclined to range trade at best.

Another property stock that caught my attention today while scanning charts is FLI. It formed a very bullish candlestick pattern today - Piercing pattern. Chances of this stock advancing tomorrow is very high with immediate resistance at 1.45. MACD is still pointing down so it would be range trading at best in the short term.

I am seeing a symmetrical triangle formation in PX. Today would have been the best time to buy it too and/or as close to 14 as possible with a very tight stop loss below 14. Bands are relatively flat so the possibility of range-trading is also there with immediate resistance at 16.

RFM is struggling at its current support - 1.79 - as both 10 and 50 SMAs are pointing out. RFM is behaving exactly as I've been expecting! Too bad most my funds are still frozen! Chances of breaking the resistance at 2 now is relatively high as MACD just crossed over the zero line. /sadface

It looks like I can ride AP once it resumes its advance next week though!

Rebound at 32 levels for DMC should warrant a buy signal.

Can't wait for my COL account to be activated hehe.

Tuesday, October 12, 2010

Personal Disclosure

The market made a relatively steep decline today, losing 1.24% - 52.27 points lower from yesterday, closing at 4166. Today is the steepest decline the index has made since the crazy run up that broke the previous high. It looks like the market is still poised to decline in the short term with immediate support at 4125.

I've not been writing much as I have been reviewing my previous trades, both gainers and losers to refine my system further. I am also currently transferring my funds to Citiseconline so my funds are generally frozen at the moment except for some that I've left on my live broker.

Bought AGI today at 10.84 with the remaining 30% of my active capital as I saw CLSA gobbling the shares up to 10.90 but wasn't able to sustain its buying before closing at 10.66 today. So that's 1.6% paper loss already. Got in too early but I wasn't able to monitor the market till the closing so that's the best choice I had today. Sell on rally as momentum in the weekly charts is showing relative weakness.

AP is looking very nice also as its MACD shows accompanied by relative trend strength. Pull backs to 24 is a buy but should wait for positive momentum to build up first as weekly charts is showing relative weakness.

RFM is still showing weakness on both daily and weekly charts so it is best to range trade it, support at 1.65 and resistance at 2.00.

PX looks like its about to bottom out on both weekly and daily charts so bounces from the support at 14 should warrant a buy with a immediate resistance at 16. If it continues to move this way, it might form a symmetrical triangle which would also warrant a buy at breakout.

MEG is about to retest its previous support at 2.20. Bounces from the said support should warrant a buy with immediate resistance at around 2.36 levels as it looks like it is forming a descending triangle. Breaking down the support at 2.20 would point to the next support at 2.13-2.15 levels. Breaking up the recent high at 2.42 would suggest the continuation of the further advance to the original target and should also warrant a buy. MACD is suggesting sideways to down movement in the short term.

DMC is also worth watching and buy as close to 31 as possible. Correction and bounces at 16.50-17 levels should warrant a buy on AT.

ALI looks like it got raped again today losing around 10% in three days.

Tuesday, October 5, 2010

Personal Disclosure

Market closed by 16 points lower in today day's session after gaining a hefty 76 points yesterday. Anyway, I posted my view on the market today so there.

As I've suspected, most of my favorite stocks are moving sideways. AGI, MPI, MEG, and FLI moved sideways today after advancing around 5% in the past two sessions. The only one that advanced strongly today is RFM. It looks like it has awakened from its six-week slumber. I can still remember my trading plan for RFM!

MPI could possibly forming an ascending triangle formation though. A convincing breakout at 4 should warrant a buy.

Philippine Stock Exchange Index (PCOMP)

Ten-Year Daily Chart PSEi


The previous advance from 3600 level was succeeded by continuous 1% gain on a daily average, breaking the previous high at 3896, before meeting slight resistance at the psychological resistance at 4000 which caused choppy movements in the recent advances. The breaking of the 4000 psychological resistance by 3% suggests that the current uptrend is still good and it is simply resting before heading back up.

Current MACD reading is suggesting that the recent high is currently at the peak of the uptrend as it has relatively the same MACD reading as the previous high at 3896 which is also confirmed by the current DMI reading.

The fast MACD line has crossed below the slower MACD line suggesting that there would be a consolidation in the short to medium term. Chances of making a combination of correction-consolidation is relatively average, possibly a retest of the now current psychological support at 4000 before heading back up.

There is a Momentum-Rate of Change to Price divergence, further confirmed the short to medium term consolidation being suggested by the MACD and DMI readings.

The market is now trying to break into the old support line (current resistance).

Support (Fibonacci Retracements): 4055 - 3943 - 3864
Psychological Support: 4000 - 3896


Monday, October 4, 2010

Personal Disclosure

Market closed 76 points higher today at 4188. Looks like the eleven-day consolidation finished yesterday.

Got whipsawed in MEG terribly as it closed at 2.39 today but you have to follow the plan. /sadface

Current position in DGTL is still lower by 7 centavos in six days. Didn't do much today except to watch the tape the whole time. I'm currently looking to range-trade some stocks if there is a viable trade setup.

I also found out a major flow in my current money management. It seems like I am exposing too much of my trading capital per trade!

Anyway, I am reading inverted charts again to see if the current trends and price movements are still valid.

Hello Monday!

Hello Monday! Looks like we're still poised for further consolidation-correction this week, courtesy of the crazy 500+ point jump this past month, plus no new news to push the prices. Quarterly company reports would be getting out sometime this month so there might be price action when that happens.

JGS is looking good as the IPO of Cebu Pacific is near. I might take a position here. Let's see how it goes tomorrow.