
Tuesday, June 7, 2011
AGI
The reasons why I didn't come scampering to this stock when it gapped down are:

1. Gap down from support.
2. Triple EMA breakdown prior to the gap.
3. Close below 11 as it completes the H&S pattern that formed
(AGI analysis dated Jan 19 http://the-morningstar-option.blogspot.com/2011/01/alliance-global-group-agi.html#comments).
Had you faded the gap, the best you could have gotten from the trade is 5.94%. That is if you got the exact low and high of the leg.

However, it appears to be forming a bullish RSI divergence on the daily chart. A close higher than today's closing will confirm the bullish divergence, suggesting a short term rally to 10.31 up to 10.63 and 11.10 as the best case scenario.
It could rally, it could not and I am not willing to place my bet on this one.
Also, the minimum short term target isn't enough to justify the trade so I wouldn't touch this one yet.
I'd wait for a bullish RSI divergence on the weekly charts in the mean time.
To the next trade!
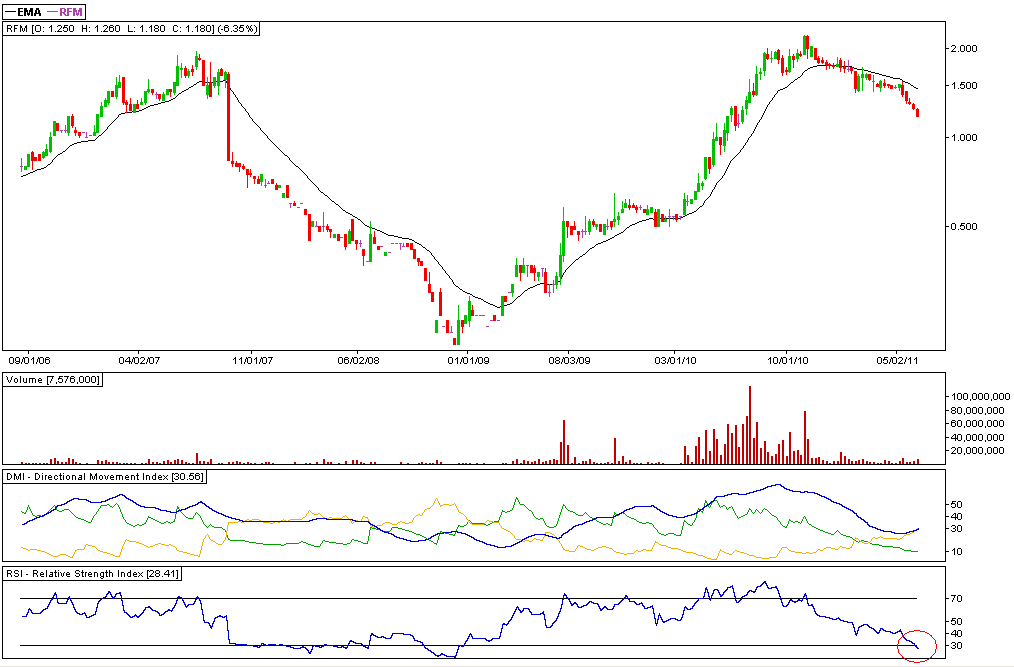
RFM: Capitulation(?)
Daily Chart:
Capitulation? Long black candle with spike in volume suggests panic selling. DMI(ADX) value has also reached the highest in the last six months. RSI value has also reached its lowest in the last six months.

However, despite of observations, I believe that it would be better to watch price action to stabilize first before taking any actions such as bullish divergence on daily and weekly charts and/or sideways breakout.

RSI has dropped below 30 on the weekly chart suggesting a parabolic drop is probably in the works.
Capitulation? Long black candle with spike in volume suggests panic selling. DMI(ADX) value has also reached the highest in the last six months. RSI value has also reached its lowest in the last six months.

However, despite of observations, I believe that it would be better to watch price action to stabilize first before taking any actions such as bullish divergence on daily and weekly charts and/or sideways breakout.
Weekly Chart:
RSI has dropped below 30 on the weekly chart suggesting a parabolic drop is probably in the works.
Trading plan: Watch the circus. Sell rallies to 20EMA.
Increased position in PX. Average of PX holdings are now stuck at the middle of the tight trading range. Target still intact, just waiting for the breakout to happen.
LC bounced off support but met resistance at its WPP. LCB hardly retraced to its breakout point. LCB has better price action.
Attempting to predict LC top for tomorrow: 0.97.
URC seems to be forming a flag/pennant. Buying pressure appears to be building up.
AGI forming a bullish divergence on the daily chart? If yes then it could probably yield a 10% gain from its new trough(none as of this writing).
Not much issue to trade with, except for mining issues and other selected issues.
Didn't touch PWR, still unfamiliar with parabolic moves. Too scared to be the one left holding the empty bag.
P1 cash div in DMC, ex-date on the 10th of June. Yield is 2.41% using the recent close(41.40).
I'm liking the 5-minute divergences. I still need more practice!
LC
Bullish divergence on the 5-minute chart

Since the last bearish divergence produced a 10% drop, I am going to assume that this bullish divergence will produce a 10% gain(at most) with an average of 4.5% gain for the mean time.

Since the last bearish divergence produced a 10% drop, I am going to assume that this bullish divergence will produce a 10% gain(at most) with an average of 4.5% gain for the mean time.