Monday, December 27, 2010
Thursday, December 23, 2010
Alliance Global Group (AGI)
Weekly Chart

1. Price has crossed above the 10EMA.
2. MACD is poised to generate a buy signal.
3. RS is recovering and building up.
Daily Chart

Price has crossed above 10EMA, 20 and 50SMA. The last time it did -early August, it made a run from 5.75 until it tanked at 10.90.
Conclusion:
Poised to breakout of its sideways movement.
Bullish on short and medium term.
If trading range is broken, pattern target: P14
Wednesday, December 22, 2010
MPI (Metro Pacific Investment Corp)
I can't believe that I missed this!

1. Buy signal on MACD
2. Support found and tested (the dragonfly candle and red hammer)
3. RSI bullish divergence
4. Price closing above 10EMA.
4 is definitely going to be tested again.

1. Buy signal on MACD
2. Support found and tested (the dragonfly candle and red hammer)
3. RSI bullish divergence
4. Price closing above 10EMA.
4 is definitely going to be tested again.
Tuesday, December 21, 2010
Now serving Whipped cream
Another whipsaw on BEL as it advanced again today by 8%. That's what you get when you try to outsmart your own system. I missed both big moves on SMC and BEL!
MBT had a weak follow through today as it only gained 0.85% today. Anyway, I'm just going to let MBT run for a while. I'll keep it until next year if it closes up strongly this week.
I doubt that day trading is for me.
AP is still looking out for support. Best case scenario is that it resumes its uptrend in 2 weeks.
Monday, December 20, 2010
Got whipped!
The index seems to be still in a choppy mood. Hopefully, it would start to resume its uptrend by early next year as suggested by the RSI and ROC.
Got whipped hard in SMC as it finally got into the lower range of the offering at 150 while BEL produced mediocre result.
Sold BEL today at 3.98.
Bought MBT at 64.50 as the confirmation of the RSI buy signal was relatively strong.
Still looking to trade stocks with momentum until the year ends!
Got whipped hard in SMC as it finally got into the lower range of the offering at 150 while BEL produced mediocre result.
Sold BEL today at 3.98.
Bought MBT at 64.50 as the confirmation of the RSI buy signal was relatively strong.
Still looking to trade stocks with momentum until the year ends!
Sunday, December 19, 2010
Thoughts before trading week
There had been alot of fundamentally sound stocks that are currently free-falling, some have found support already while the others are still doing their thing.
Although it would be best to wait for the dust to clear out for the others, what would be the right thing to do with the stocks that have found support already?
One particular stock is looking extremely attractive technically and I wanted to try my theory out since I couldn't find concrete answer in the interwebs.
Let's see if I could trade them before this week ends.
Friday, December 17, 2010
Christmas ain't so bad after all...
I don't know what's up with BEL but it's going up with exceptional volume today. Looks like 4 is going to be taken out on Monday as the bid volume at the closing is very good. My favorite guru also gave a sell recommendation on this one so I am holding! :P
MBT continues to slide down. Looks like my target for the H&S are going to get hit!
AP is simply consolidating in the time being and I am expecting it to do so for about another 2 weeks, give or take.
Most of the stocks on my watch list are, well, taking a vacation already.
SMC is 140 already, P10 to go before the low end of offer range at 150.
Currently on the lookout for buying windows and I am currently looking at:
AGI - Consolidating/moving sideways
DMC - Consolidating
JGS - Oversold
MER - Gaining momentum(?)
MBT - Oversold
URC - Oversold
SMC - RSA play factor
Thursday, December 16, 2010
Cashout for Christmas
The market lost another 35.83 points today closing lower by 1.23% at 4039.40 with relatively average volume.
Another lousy day and I was simply waiting for trade setups the entire session.
AGI looked relatively week as it formed lower low on RSI. I think it's going to head down a little further in the short term so I'll just avoid it for the meantime until it gets extremely oversold.
DMC still looks weak in the short term. I'll be waiting for momentum to buildup for the meantime.
I'm expecting a signal to form in 2 days in MER just for confirmation as it is already resting at 50% fibonacci level.
I'd probably get back on SMC next year.
Interestingly, a trade setup appeared in BEL today despite of the overall weakness of the market so I bought at the closing at 3.83. Hope it gaps up tomorrow.
Oh, and MBT broke down heavily today, breaking the third support(main) line so I'm expecting it to head further down to 54-58 levels and/or until it is extremely oversold.
Wednesday, December 15, 2010
Boring day is boring.
The market closed lower today at 4089.75 losing 58.28 points, lower by 1.40% from yesterday. Looks like the week is going to end flat.
Sold SMC today at 135.20 covering the small loss I incurred in PWR yesterday with the same capital.
Position in AP is flat and I am expecting it to move sideways until late late December to early January.
I am currently looking to trade AGI, DMC, MER and possibly SMC for the meantime while the market is still relatively choppy. I am just waiting for a trade setup to form.
I am also looking at/for blue chips that are extremely oversold.
Metropolitan Bank and Trust Com. (MBT)
MBT Daily chart

Breakdown from 2 major support levels at 68.50 and 75.50, head and shoulder neckline breakdown at 68.50 pointing at 54-58 as a possible target in short/medium term.
It is also resting now at the major trend line. A breakdown from here would suggest further decline in the short/medium term, confirming the down trend up to the H&S target.
Avoid until it finds solid support.
Tuesday, December 14, 2010
The market gained 32.65 points today, closing higher by 0.79% at 4148.03 on a higher turnover.
I took a position in AP again today at 32.30, higher by 3% than my stop yesterday.
I tried to day trade PWR as I thought it still has leftover momentum from yesterday but I was wrong so i sold it wil a small loss at 0.40.
I also took position in SMC at 134.
I am also looking at MER for a possible trade setup but there is no buy signal just yet.
Let's see if red is the color of Christmas.
Monday, December 13, 2010
Red is the color of Christmas
The market continued to decline on a lower turnover, declining by another 20.37 points, lower by 0.49% from last week's closing. Looks like we are going to go sideways until proven otherwise.
AP declined further in today's session, closing lower by 3.40% again. My medium term stop with AP got hit today so I sold my entire position at 31.80 and 31.60. I don't know what ATR is thinking but most of the foreign brokerage houses are selling and I don't see ATR supporting the stock. Anyway, my best case scenario for AP right now is to form a lower high in the short term and move sideways although I would still be on the lookout for a good buying window and I am hoping to get a bargain for it.
There are two setups that I am currently looking at so I'll wait and see how they go first.
Thursday, December 9, 2010
The market lost 11.67 points today closing lower at 4209.42 with lower volume turnover.
Looks like we are currently consolidating in the short term.
AP continued to declined today as foreign brokerages that have bought lower continued to sell their previous positions and lack of support, losing another 3.10% closing lower at 32.80 - ATR's entry price. It's going to get ugly if it goes way below his entry.
Technically, it hasn't dropped this much since May 27 this year. I am expecting it to bounce by tomorrow though up til by mid week next week.. The buy signal that was given off two days ago is confirmed weak so it would be better to wait for a stronger buy confirmation before going in.
AP is up by 21.17% within 33 trading days.
Wednesday, December 8, 2010
Personal Disclosure
The market ended up in the green territory, closing higher by 23.17 points at 4221.09, higher by 0.55% from yesterday's closing suggesting that the market is tired from the recent bounce/run up and it might consolidate for the mean time.
AP recovered from the recent decline today, gaining 0.74% closing at 33.85. The buy signal given yesterday had a weak confirmation today so today would be a so-so entry. A strong closing in tomorrow's session would confirm the upswing in the immediate future.
The old timers JPMorgan and MACQUARIE continued to take profits today while a new comer EIB SEC bought alot of shares in the market today.
AGI gave off a buy signal today while filling out the previous gap up. If the signal is confirmed tomorrow, that would signal the beginning of the next upswing.
DMC continued to advance today despite looking toppish already.
SMC broke out of its consolidation today, closing higher by 5.74% at 129. However, it also gave out a take-profits signal so I would be inclined to take profits by then at the opening as it seemed to open higher by tomorrow. Let's see how this trading simulation goes.
AP is up by 25.05% within 32 trading days.
Tuesday, December 7, 2010
Personal Disclosure
The market declined in today's session, closing lower by 25.20 points or 0.60% at 4197.92, which is obviously caused by profit taking by bargain hunters from the recent drop. The MACD is now about to cross back up above the zero line suggesting the resumption of the uptrend. We might make another higher high before the year ends.
AP continued to decline further in today's session, losing 4% and closing at 33.60 with a total of 6.25% within 3 days from its recent high. Today, it generated a buy signal with a confirmation tomorrow. However, momentum is definitely starting to weaken so I would be very alert in watching danger signals.
I was out the entire session so I didn't see what really happened in today's trading so I simply checked the records from COL instead. Looks like DAIWA and ATR are still buying although in lesser volume while the previous buyers(from the lower range) UBS, DEUTSCHE, PEP, WEALTH and MACQUARIE are all selling.
Weekly chart is still looking normal though so intermediate to long term holders need not fret.
AGI did a fake breakout from its ascending triangle pattern with a high of 13.12. A buy signal should be generated within two days but don't try to get ahead of the signal. Better wait and confirm it before acting on it.
DMC is looking to crossing back up above the zero line(MACD) suggesting the resumption of its uptrend and it also broke above its short term downtrend line although it appears to be relatively toppish already so it might consolidate for the mean time.
AP is up by 24.13% within 31 days.
Monday, December 6, 2010
Quick Update!
Looks like that the market is going to form a higher high(from the previous high but not a new high) this week. There's also a take profits signal for tomorrow on the daily chart for the index as the index now appears relatively toppish already.
AP declined further today losing 1.13% closing at 35. A bearish divergence also appeared on the RSI and ROC so those are warning signals. I would be taking profits if it continues its bearish divergence in the coming weeks.
Currently waiting for the Santa Rally~
AP is up by 29.30% within 30 trading days. One percent a day keeps the bears away~
Sunday, December 5, 2010
Weekend Update
Looks like we did find the bottom last week. However, profit taking occurred in several stocks that went on a bargain sale few weeks before. Are we going to continue heading back up now? I think so as to what I am seeing on the weekly chart(red circles):

Although we could still experience some choppiness early this coming week.
Looks like I was right with my AP reading(for short term) as profit taking surfaced during mid-session, giving up 1.12% at the close, closing at 35.40.
Intermediate trend is still up so no worries for AP right now, as being suggested by its weekly chart.
AGI gave off a take-profit signal(short term) for Monday. Looks like the pattern needs to wait for a little longer.
DMC is looking to break above its downtrend line! Hopefully, no major profit taking for those who bought at the recent low so the price won't be pushed down just yet.
AP is up by 30.78% within 29 trading days.
Thursday, December 2, 2010
Trade Setup: AP - Status: Open

The red box indicates where I initially believe that the price will head back down again as it broke down from its support - which I believed it should not so I didn't buy yet. However, I was wrong in my analysis that time so I decided to be on the right side of the market: Buy and go long.
B1 = First set of buying was staggered: First part was done @25.85. The buying during the entire session was strong I decided to chase it and got the second part @25.95.
It closed at 26 - the buying of the stock was immediately proven right as it immediately showed profits.
B2 = Second set of buying was also staggered: First part was done @28. The buying during the early part of the session was strong so I decided to chase it and got another set @28.25. However the buying was unsustainable, and it closed lower at 27.90, indicating that the timing of my buying that day was terrible. I let it run though as the reason for buying that day was still valid.
I was trying to buy a cross over of price below the 10SMA. However, price never dropped below it so I bought as close to 10SMA as possible.
Earnings report is the other reason why I took position.
Initial personal target price was 35. However, personal tp was reached and breached today so I am extending my holding period further because two foreign brokerage houses bought a large amount of shares on the market.
ATR buying: The day ATR buying was evident.
Deutsche buying: The day Deutsche buying was evident.
ATR buying has also formed a hammer candlestick(bullish indication) and price opened below the 10SMA but closed higher. It should have provided a good entry for a short term trade - if you weren't too afraid to buy.
The red circle on the MACD suggests a short term take-profits signal.
The red asterisk on the rate of change would suggest short term peak.
TOP 20 Buyer-Seller:

The image of the top buyer/seller is to see who's getting in and who's getting out within this past 3 days.
General trading plan: Sit tight and let the profits run wild.
Lesson in this trade: Averaging up works; always buy what's showing strength;
and don't be too quick to take your profits. :)
The big question: Will AP continue to advance in the short to medium term?
Well, you wouldn't know until you bet.
So, are we there yet?
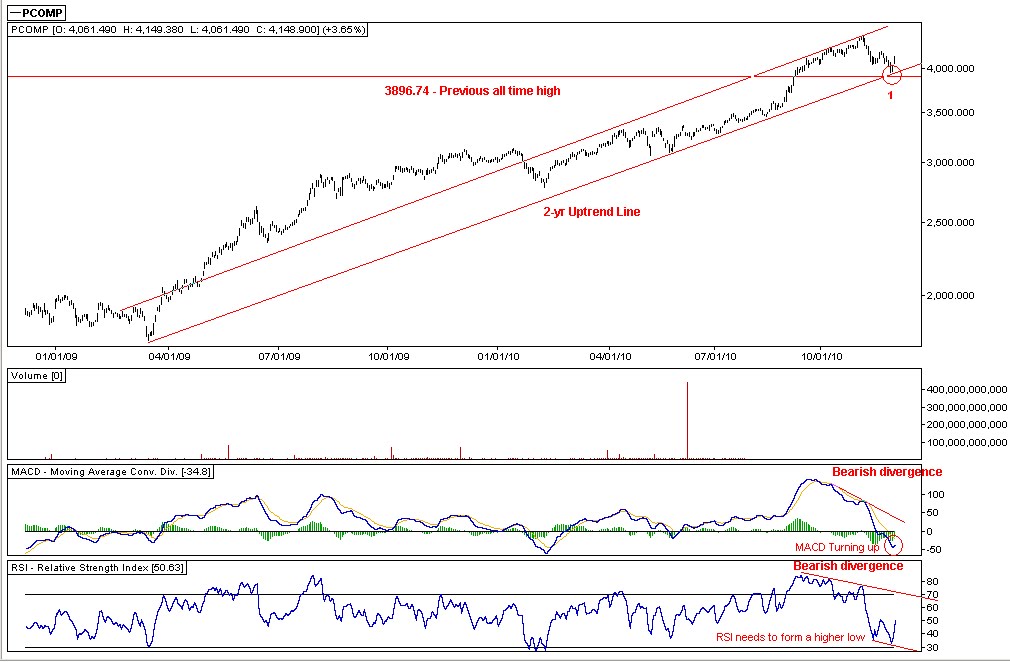
The market bounced strongly today, gaining 146.02 points, closing higher by a whopping 3.65% at 4148.90. Looks like we did find a bottom yesterday:

The market bounced from the 2-year uptrend line(1) which I believe the major uptrend line. RSI needs to form a higher low to indicate the strength/bullishness of the trend.
Looking at the PSEi weekly chart:

As we can see, the crossing of the faster line below the slower line(MACD - red cirlce) indicates that the recent decline in the daily chart is simply a correction and RSI is still normal - meaning no bearish divergences or what so ever is visible on the chart as of this moment.
We can conclude from this that the uptrend is still intact - for the mean time- up until the current uptrend line is broken.
AP. AP. What can I say? Nothing much as it is simply heading up after our foreign friends started to gobble up alot of shares in the market and I highly doubt that they would let the price fall below their entry.
AP gained a nice 7.51% today and the most active stock today while AGI is the second runner up.
Technically speaking, I have a screaming take profits signal for tomorrow for short term trading. As of now, I am trading AP for intermediate term already. My personal target of P35 has been already reached and breached so I am simply letting my profits run and go wild now.
AGI is looking to break out from its ascending triangle chart pattern pointing at 15.24 as a possible target although I think that my system will generate a take profit signal within 2 days but our foreign friends has also gobbled up a lot of this stock so let's see what's going to happen.
No short term trades for me as of the moment as I am trying to lessen the stress when trading.
Current position:

Within 28 trading days.
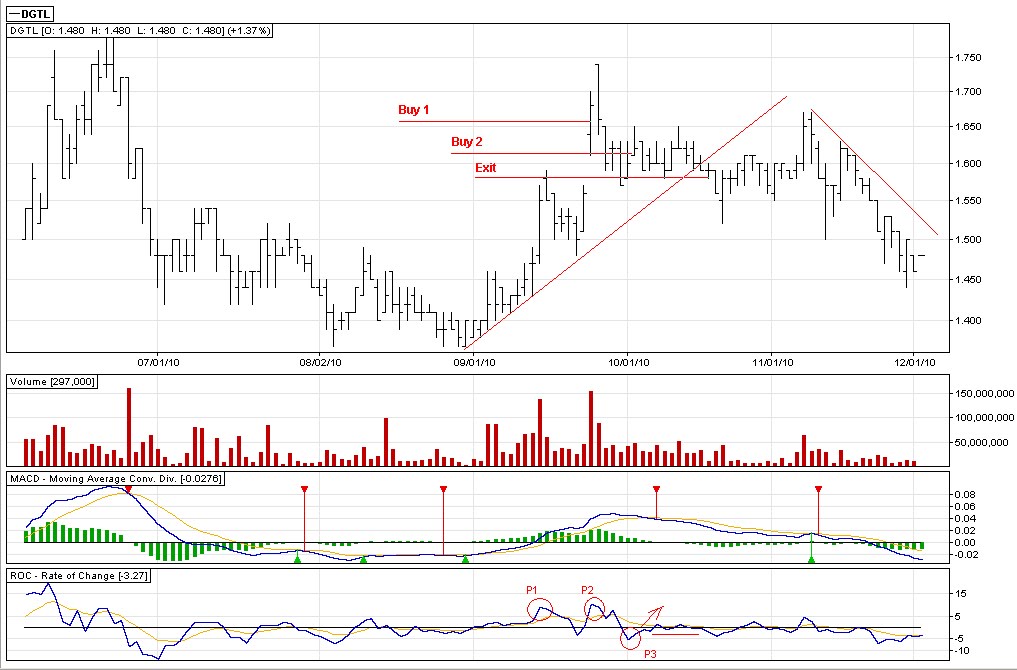
Sucker Play 101: DGTL
Here is a previous trade that went sour:

Buy 1: Bought it first at 1.68. My reason for buying it was the gap, that was pointing to 1.89 as an immediate target. However, the next day, it reversed closing lower and now pointing to fill the gap but I was being stubborn that time so I held to my position thinking it would be quick to rebound the next round.
Buy 2: Bought another set at 1.63 thinking it was the bounce that I was waiting for. However, just like the first trade, it reversed immediately the next day. The reason behind this second set was (1)I thought it was the bounce that I was waiting for; (2)Rate of change has started to point up suggesting an upswing in the short term - believing that it will reach the previous peak at P2; and the last but the most fatal error one could make in a trade: (3)Read on a forum that Abacus(brokerage) was accumulating because it has a "very good" earning report that is coming out come 3Q earnings report - which was also magnified by another guru saying that DGTL story is a turnaround story.
After 9 trading days, the uptrend line was broken so I decided to take the hit and cut loss to preserve capital and to avoid further loss in trading opportunities. I sold both positions 1.69 and 1.64 at 1.59.
The trade averaged a 6.84% loss to the entire trading capital.
Conclusion:
If I didn't take the hit and sold the entire position, I would still be incurring further losses as it continued to decline further up until now and I would have missed a very profitable trade that I have which is still open(Aboitiz Power).
Lessons from the trade:
(1)Never trade without a plan.
(2)Never make a plan after reading other people's analysis on a certain stock.
(3)Never trade on a tip. When there's a tip, there's a tap.
So the big question now: Is DGTL a turn around story? See it for yourself.
Don't be a sucker.
Wednesday, December 1, 2010
Traders Psychology and why 90% of traders fail
1) Anything can happen – there are always unknown forces and traders operating
2) You don’t need to know what is going to happen next to make Money - So long as you have an edge then the laws of probability will decide the outcome over a series of winning and losing trades. Market info is only threatening if you expect the market to do something for you. If you don’t expect the market to make you a winner every time you will have no fear of losing, if you don’t expect the market to keep going in your direction you will take profits off the table. If you believe this then how can the market make you wrong. If you believe anything can happen then you will always be right. If the odds are in your favour then every loss puts you closer to a win.
3) There is a random distribution between wins and losses for any given set of variable that define an edge. : If you believe this then you will be looking for anything that meets your criteria of an edge and jumping in without hesitation. If you still believe trading is about analysis for each loss you will be doubting your edge and gathering yet more info.
4) An edge is a higher probability one thing will happen over the other. The only evidence you need to gather is whether the variable you define as an edge are present at any one time. When you use other info you are adding random info outside of the parameters of an edge to your trading regime. This will create a random inconsistent approach that will lead to random inconsistent results. Why bother gathering further info, if the market is offering you a legitimate edge, determine the risk and take the trade.
5) Every moment in the market is unique. If each moment is like no other then how can you know what will happen next, so why bother trying to know. The best traders have trained their mind to believe in the uniqueness of each moment. If you believe in this uniqueness you will not associate and your mind will be open to perceive what the market is offering from its perspective.
You will enter “the zone” when you are tapped into the “now moment” opportunity flow. This will happen when you are at peace with not knowing what’s going to happen next and make yourself available to the market.
Trading in the Zone
Boring Update
The market recovered today after the huge drop yesterday caused by the selling of DBP-Daiwa of index issues, gaining 49.18 points back, higher by 1.24% at 4002.88 - back at the psychological support. Will the market start bouncing from here? Probably. Probably not. If the market continues to be weak, next possible resistance would be at 4120 before it starts heading back down. The next good thing that it would do is to retest the recent low at 3953 levels, before heading back up with the resumption of the uptrend.
On the weekly charts, the index is probably at the bottom already so if the index starts moving back up again here, that would be a better confirmation of what's going to happen next.
Looks like the buy signal that AP generated yesterday is good. A lot of AP shares are now in the market with an average of 32.80 and looks like the big guy is done accumulating shares already so I think they are going to pump the stock now.
Technical indicators are pointing up suggesting further advances in the short term, probably up until late next week or early the week after. However, I'm still assuming I'm wrong until proven otherwise.
AGI is looking great too as it is currently forming a ascending triangle pattern(bullish) with a possible target of 14.80. Price is currently at the lower part of the pattern which should have provided a good entry for those who have appetite for risk. For the conservative ones, an upswing in the weekly chart should be their signal.
AP is up by 23.02% within 27 trading days with doubled up position.
*Wanted: Metastock for christmas!