Always stay with strength.
Price movements make news, not the other way around.
Now, go look for a strong stock!~
*Only problem now is I am seeing alot of bearish RSI divergences on most of the stocks that I am currently monitoring. Most of them could still advance but only in the short term.
**Western markets are dropping btw.
Wednesday, January 19, 2011
Filinvest Land (FLI) and Megaworld Corp (MEG)
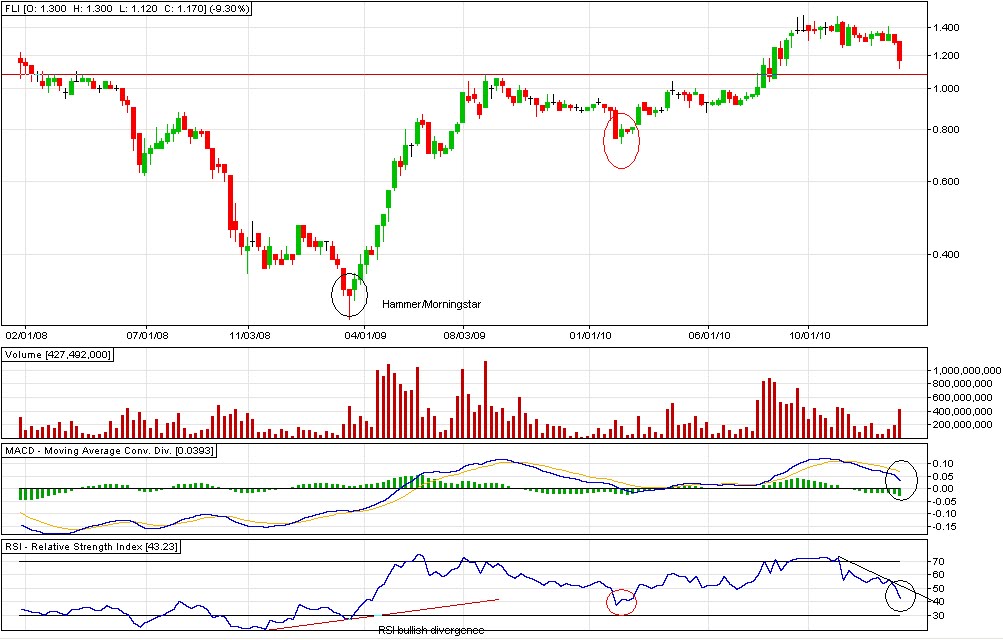
FLI weekly chart:

The setup that I will be looking for before putting up position in FLI is a setup similar with the red circle, an sign of recovery in RSI after the huge drop pointed out by the bearish divergence in RSI.
We already have the huge drop in play. Waiting for sign of recovery. Profit taking would be somewhere at 53 RSI.
MEG weekly chart:

Same game plan with FLI. RSI 35 would seem to be a good place to start catching falling knives. Looks like there is still possible downside in the short term.
Both have hammer candlestick formations. However, I have bad experiences with red hammers without confirmations so I am still not touching them until signs of recovery.
APC Group Inc (APC)
I know I shouldn't be buying the stock first without studying its chart but I already did bought without proper research so I'll study the next position that I'll be taking.
Anyway I was trying to convince myself that buying APC was right. I think I found one:
*Bad trading habit!
APC 5-Year Weekly Chart:

1. Clearly that the major trend is up.
2. Price is currently trading(resting) at its resistance at 0.89.
3. Fresh MACD buy signal.
4. RSI reading is still not overbought.
With this being said, I might still have a couple of weeks for it to climb up before starting its really loooonnnnggggg consolidation.
Prices are poised to break that 0.89 resistance levels as the current RSI reading neutral(not yet overbought).
Once 0.89 is broken, I am expecting it to test the psychological resistance at 1 which I believe will be taken out(biased lol). After breaking the psychological resistance, 1.28 would be the immediate target.
I would close my position if:
1. price meets strong resistance 1.28;
2. weekly RSI hesitates at 75-78.
Strongest weekly RSI reading is 90(1.28).
Now that I found reasons not to be shaken out, I can sleep soundly at night again. :)
I'll study the charts before putting up a trade next time, promise!
Alliance Global Group (AGI)
Here is the weekly line chart of one of my favorite stock to trade - AGI:

*I used line chart to see the formation clearly although the pattern is also visible in the bar and candlestick charts.
It appears that a head and shoulder formation has formed on the weekly charts - which is very hard for me to ignore.
Book definition of head and shoulder pattern:
1. Needs a prior trend to reverse.
2. Left shoulder that marks the high point of the trend.
3. Head forms as a higher peak forms, exceeding the previous high. After peaking, the low of the subsequent decline marks the second point of the neckline. The low of the decline usually breaks the uptrend line, putting the uptrend in jeopardy.
4. Right shoulder forms as price advances from the low of the head which is lower than the head. The decline from the peak of the right shoulder should break the neckline.
5. Neckline forms by connecting the two lows.
Neckline break(most important part of the pattern): The pattern is not complete and the uptrend is not reversed until neckline support is broken. Ideally, this should also occur in a convincing manner, with an expansion in volume
6. Once the support(neckline) is broken, it would now turn into the resistance level. Sometimes, but certainly not always, the price will return to the support break, and offer a second chance to sell.
7. Price target is projected by measuring the top of the head to the neckline. The distance is subtracted from the neckline to reach a price target. However, the price target should only serve as a rough guide. Other factors like previous support levels, Fibonacci retracements, or long-term moving averages should also be considered.
AGI Chart Analysis:
1. Check.
2. Check.
3. Check.
4. Check.
5. The two lows(green circles) are pointing at 11 as the neckline. Price breaking and closing below 11 would complete the pattern.
Initial target after breakdown: 9.04 (9)
Resistance after breaking down: 11
Will it break the support? RSI reading gives the clue on possible price movements in the short term.
Tampons for the bleeding.
The selling eased out in today session, dropping lower by 33 points in comparison to yesterday's 76 point drop. It feels like we are going to find a higher low tomorrow.
The index looks like range trading from 4000-4200 levels. I think I just got my wish granted. Hopefully, index issues provide a significant range to trade.
NIKL, the current star of my portfolio, has finally broken out convincingly out of its previous high. It has also broke its psychological resistance at P20 and it is now trading at its all time high.
I put on additional position in NIKL today(+30% of my current position) and I am still not done putting up the whole position.
My position in APC has started to recover today and looks like there would be continuation. If P1 is taken out tomorrow, I believe it would be safe to assume that it will continue to advance further in the short term as suggested by RSI.
Positions in CYBR and ELI are both bleeding today. ELI tried to fill the gap today.
Buying opportunity on CYBR tomorrow(?).
My timing in my recent positions in APC, CYBR, and ELI is terrible. Position sizing is saving me though.
It feels like something is brewing in MER but still no guts to buy. I would probably trade it once it break 300.
SMC filled the small gap at 160-162 last December 28, 2010. Resistance at 189.
Range trade?
I'm going heavy on mining. There is this one mining issue that I have been monitoring secretly and looks like it is also going to break its most recent high. It is a highly despised stock but it is quietly trending up.
Are people still fearful or superman effect has started to surface?
*Buy at the closing on red days and sell on panic buying days on third liners?