Gap downs up to secondary weekly support is a buy?
Wednesday, August 10, 2011
Tuesday, August 9, 2011
I am a Trader
I am a Trader
a trader ALWAYS, and I mean ALWAYS, thinks of risk first
a trader understands the game is rigged and makes no excuses about it
a trader is patient
a trader understands that the market adapts and forces the trader to adapt with it
a trader deals in probabilities not possibilities
a trader has a plan and trades the plan
a trader understands there is no such thing as a sure thing, or free money
a trader is humble and understands they can’t understand every move in the market
a trader is disciplined
a trader is persistent (it takes a lot of time to absorb a feel for the markets)
a trader realizes that it is not their place to determine what is or isn’t “irrational behavior”
a trader understands they will not catch every move
a trader always has an exit plan
I am a trader, are you?
Thursday, August 4, 2011
Monday, August 1, 2011
Thursday, July 28, 2011
Wednesday, July 27, 2011
Monday, July 25, 2011
Sunday, July 24, 2011
Tuesday, July 19, 2011
Bailed out on PWR today. My trailing stop at 5.10 was triggered so I had to sell and take profits. The only problem earlier today was COL going bananas. The ticker is showing 4.80+ while the quotation reading is still above 5 so I really had a very bad fill for my trailing stop which is pissing me off. I had a plan and I was trading the plan and yet, the broker won't let me trade my plan. LOL.
Anyway, average entry is below par so it is still a pretty good profit (ROI: 23%). My only regret in this trade is that I sold half of my position at 1.37! I should have increased my position since it was climbing up. Oh well, hindsight.
Didn't have any position on the blues since 40% of my funds were in LCB, 16% in GERI and the remaining fund was freed up for the second/third liner plays(shoot anything that moves) so when LC/B started to attract attention, I just increased my position in LCB (by 57%) today. Let's see if I did the right move.
All of the proceeds that gained from the basura plays are plowed into PCOR and SMC which both gave signals to buy. All the barya that's left were used to buy a very small position in LC(masabi lang may LC).
Bought the 3k VITA shares earlier today at 1.10 since I was expecting it to spike up. 5 minutes later it was trading at around 1 peso already so I sold it immediately. Sayang 300 pesos. Profit from the ELI trade was around 200 pesos I think so I've only lost coffee money.
Earlier this year, same time when the market was slowly trending down and trying to kill everyone long on index issues, I tried my hands on trading third line issues which resulted in either a loss or a missed opportunity. I was told that charting/technical analysis doesn't work on those so I promised myself that I will find a way to trade the said type of issues.
I think I did and I think I will be keeping it for myself in the mean time.
Thursday, July 14, 2011
Wednesday, July 13, 2011
Tuesday, July 12, 2011
PWR: Enter Parabola
Entered the 70 RSI levels on the daily chart today, closing slightly higher than its second weekly resistance(1.26):

However, prices have dropped below the 70 RSI levels on the 5-minute chart:


However, prices have dropped below the 70 RSI levels on the 5-minute chart:

Weakness on the 5-minute chart chance to average up since the bigger time frames are bullish? RSI confirmation once it bounces off the 50 RSI levels.
Meanwhile, it has entered the 70 RSI levels on the weekly chart today, closing slightly higher than its second weekly resistance(1.26):

While staying afloat in the 70+ monthly RSI levels the entire time:

MR3: 1.58
Meanwhile, it has entered the 70 RSI levels on the weekly chart today, closing slightly higher than its second weekly resistance(1.26):

Flag pattern target(breakout point: 0.88): 1.55
While staying afloat in the 70+ monthly RSI levels the entire time:
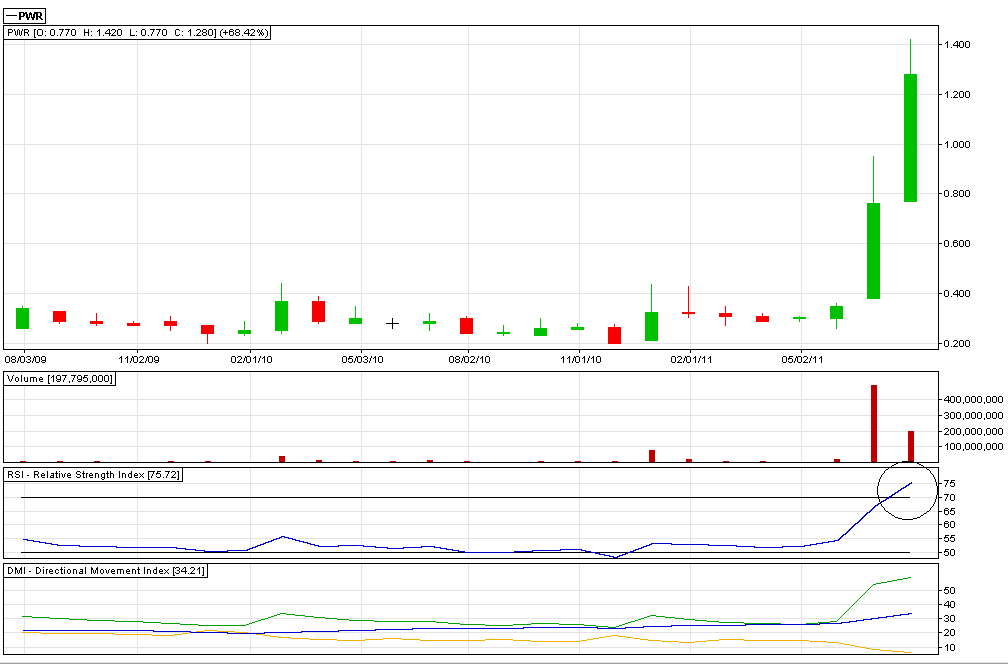
MR3: 1.58
Monday, July 11, 2011
Saturday, July 9, 2011
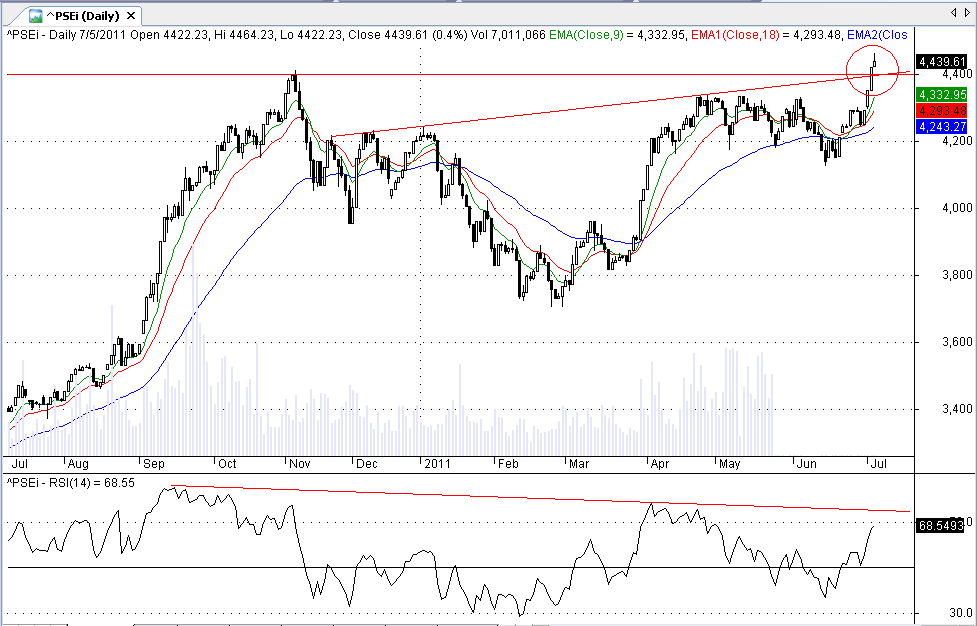
PSEi
The index pulled right back after reaching its secondary monthly resistance(2) after breaching the monthly pivot point(1) which was also confirmed by the RSI bouncing-off(3) the 50 level.

For the upcoming week, the index needs to close higher than 4400 to continue the upswing with 4500(4514) as a potential target/resistance. Anything higher than that could mean a steep climb, with RSI confirming hopefully, and 4500 could turn into the new support.
However, failure to break past 4400 could ruin the bullish sentiment and the index would probably land at 4300(4290) this week.
Index level is also bearishly divergent to previous high(lower RSI from previous high).
Trend strength appears to be relatively weak as suggested by the DMI reading(not picking up).
Gold ($GOLD - Continuous Contract) + FX: Trial by fire
I am baffled with my stupidity in my trades this week(in GOLD and in EURUSD), but so far, none of previous mistakes can top my stupidity in GOLD this week!
Here's the reason why:

Okay, so far, my mistakes came from putting on too tight stops(trailing/loss) so I am going to trade with no stops this week. Let's see how terrible the outcome will be.
Anyway, moving on, enough with the sour-graping, Gold pretty much looks like sideways with a slight downward bias, looking to pullback to the 200 MA which should provide a relatively safe entry with excellent upside potential plus the fact that it could break into a new high:

Trade with bigger volume on the long side on the 200SMA pullback setup:

Wednesday, July 6, 2011
FX: Trial by fire
I am annoyed as hell today as my technically sound logic of shorting EURUSD today went "unprofitable".
This picture best describes what happened:

Missed 120 pips of profit on 20k units or $246. That trade could have made the week. Imagine if that was real money.
/ragequit
This picture best describes what happened:

Missed 120 pips of profit on 20k units or $246. That trade could have made the week. Imagine if that was real money.
/ragequit
Tuesday, July 5, 2011

PSEi: Heading towards new highs?
Obvious bearish divergence. If divergence is still present after 3 pushes to its high, take profits.
I am expecting a short term correction after breaking out of:
1) previous resistance - 4413
2)inverted head and shoulder pattern - target: 5095 (695 points); however, the pattern is too big to be deemed accurate so the index would either fall short or overshoot the target;
bulls are hoping to overshoot the target so everybody would be happy.
Breakout seems legit as the accompanying volume is exceptionally high(7+Bil TO) today
As for the short term correction, I am hoping for a shallow one so there would be more steam for the next leg.
Index weekly:

Monday, July 4, 2011
Wednesday, June 29, 2011
Thursday, June 23, 2011
Calculated breakout entry for PX is at 21.01 but RSI is not confirming any breakout. Pretty wide trading range 18-21 for the mean time.
Calculated breakout entry for AT is at 20.75. But at the current rate of ascent, the price appears to be the short term peak. Look to position at the second gap(19-19.24).
Calculated breakout entry for AT is at 20.75. But at the current rate of ascent, the price appears to be the short term peak. Look to position at the second gap(19-19.24).
Wednesday, June 22, 2011
LC/B barely moved today while AT and PX jumped with 4+% gains. I think PX will enter a parabolic run when it closes higher than 21.75.
Issues that are lingering just above 50SMA are ICT, MBT. NIKL appears to be forming a base.
The index appears to be at its immediate resistance(50SMA+50RSI).
Not much interesting moves on the PSE so I am still practicing on trading FX(EURUSD and XAUGLD pairs) on my free time. I still get frustrated from time to time as I continually forgets my basic trading rules :))
Forex trading appears to be more promising nonetheless if done properly. There would be no more need to wait for quarterly earnings report.
I asked around again the local forums with regards to forex trading. Let's see who would even bother answering :))
I think Gold($GOLD) is preparing to challenge the 1574 levels again in the short term. Think long!
Tuesday, June 21, 2011
TEL: Divergence
Divergence: Deal or no deal?

The only thing that disturbs me with TEL is the flat price action in between divergences, inclining me to believe this action as a fake one.

The only thing that disturbs me with TEL is the flat price action in between divergences, inclining me to believe this action as a fake one.
I am having trouble seeing what's real with all the superficial closings last week.
No meaningful moves with LC/B while most of the oversold issues rallied today.
LC is being slightly bearish on the 5-min chart while LCB is slightly bullish on the same time frame.
This might suggest further consolidation in the short term. Still waiting for a rally with huge range/bearish RSI divergence.
AT broke and closed above its box resistance @18, looking forward to 19.50 as a short term target.
MEG rallied(DCB?) off its MS1 today. Short term target @2.14 levels(MPP and 50EMA).
Most of the gainers today, I cannot read.
Started another FX demo account with US$3k. Applying proper stops and money management now after turning a winning trade with the previous account into a loser.
Monday, June 20, 2011
I think I kind of getting it not to keep positions overnight. From a $700 gain from the long position in EUR-USD last Friday that turned into a $200 loss today as the initial stop loss was hit, I feel disheartened. I probably should have placed a stop before going away. This sucks. I'll never leave any open position overnight the next time around. /wrist
Saturday, June 18, 2011
Friday, June 17, 2011
Thursday, June 16, 2011
Wednesday, June 15, 2011
EUR-USD: Short position

Sold EUR earlier today but my trailing stop got hit so I am trying to optimize my stops/trailing now plus the optimal position size. Trading on the bigger time frame gave better returns(pip per se).
Majority of my "winning trades" before came from the short side. Majority of my losses are from choppy movements in the 10-sec frame. Thanks to my uberly stupid position sizing, my losses are greater than my winnings lol.
It really feels easier to make trades on the short side.
Currently focusing on trading 1 pair only which is EUR-USD.
Sold EUR-USD again earlier on bear flag breakout. Let's see how this one pans out.
*Doji candles seems to be working well on the 50EMA.
Trial by Fire
Currently short on EUR-USD, reduced size of the position and applied a suitable stop loss and trailing stops. I probably shorted a little higher, no thanks to my stupid position sizing and stop loss. Now trading on the 15-minute chart with the same triple EMA crossovers.
Tuesday, June 14, 2011
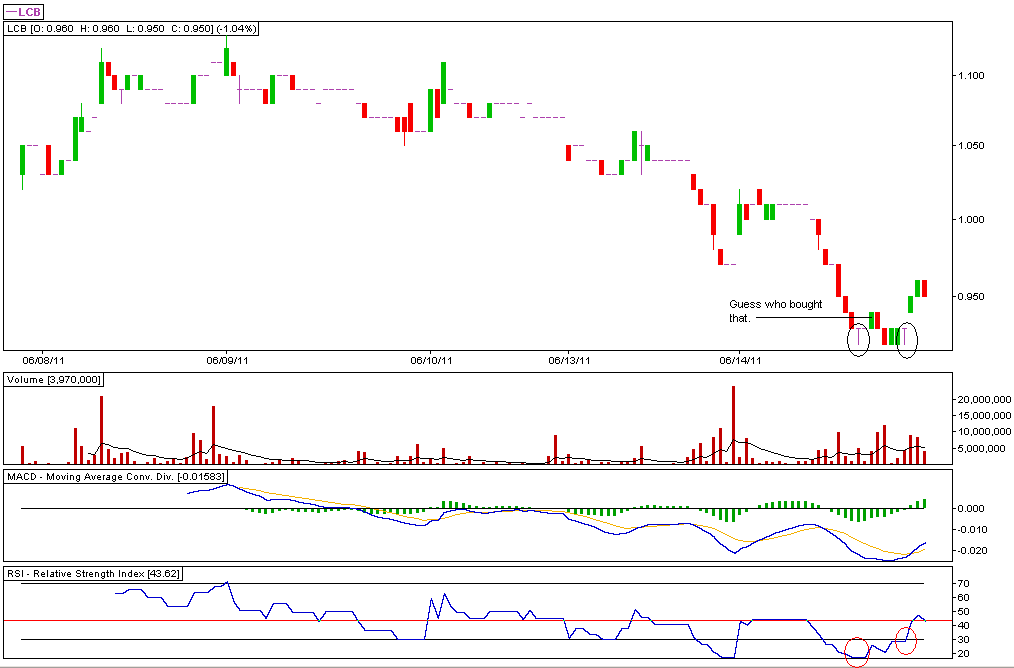
LCB
Divergence on the 5-minute chart

I chose LCB over LC because it is lighter.
LC bounced off MPP.
Let's see if this move is sustainable throughout the week.
I chose LCB over LC because it is lighter.
LC bounced off MPP.
Let's see if this move is sustainable throughout the week.


Monday, June 13, 2011
Trading update and FX: Trial by fire.
Nothing much to post today as I was at school earlier and was only able to trade by 10:30am. PX/LC/LCB has already drop in within the levels of my expectations(+/-10%) courtesy of the bearish divergence on the daily chart so the issues could rebound anytime, most likely when DOW/GOLD rebounds.
I tried to scalp earlier today despite of the crappy market this noon. Got my hands some papercut trying to trade XAU-USD and USD-CHF with my trend/volatility system despite of both being range bound. So I lost the $400 that I gain in EUR-USD the last time which I am trying to recuperate right now on EUR-USD again and I kinda recovered half of what's lost already.
I think it's alot better to trade EUR-USD than GOLD and CHF as I always have terrible fills in both GOLD and CHF.
Somehow, it feels like it's alot easier to trade on the short side?
Candlesticks doesn't seem to work on the 10-sec chart...
Maybe it's just my imagination.
Next time I'll make another demo account with smaller capital($1000) as I don't know if I can handle the $5000 account with maxed leverage on actual trading. Right now, I am trading the whole account in 1 position only with maxed leverage with a very tight stop.
*Ninja edit: My take profits point didn't get hit just now @1.4350 in my short position (EUR-USD).
Friday, June 10, 2011
FX: Trial by Fire
Day 1: -3600$$ (US%100k - Different account)
Day 2: -400$$ (US$5000 - Different account)
Day 3: +395$$ (US$5000 - Same account: D2 )
Day 4: -740%% (US$5000 - Same account: D2 )
Day 2: -400$$ (US$5000 - Different account)
Day 3: +395$$ (US$5000 - Same account: D2 )
Day 4: -740%% (US$5000 - Same account: D2 )
Forex demo account : Trial by Fire.
I have been thinking really hard on what I am doing wrong in the forex the past 2 days since I lost around US$3600 the first time I tried.
Day 1
The first system that I tried was using was a 9-50 EMA crossover on a 30-sec chart, which takes both long and short position. At first I was impressed as it produced profits on both sides. But when I checked my trades, the crossover produced only a maximum of 8 pips which kinda sucks since I had been reading other people's disclosures of minimum of 100 pips. Then the choppy session came. The losses from the sideways session piled up together with the 8 pip gain that I didn't take, I was devastated and my head started to spin so I decided to take one final trade before calling it quits for the day. I went short on GOLD and slept.
The next day it had a 2.45. That's 2450 pips if I'm reading it right, right? I closed it because it was a half-meant trade so I am counting that one on pure dumb luck.
Lost 3600USD using the system in a 100k account(3.6% of capital).
**No idea on how pips work, where to put the stop loss, trailing stops, and proper position size to maximize the leverage. I didn't even know how buy/sell stops work lol.
Day 2
So I made a new account and put a more reasonable and realistic amount that I can actually put up. This time I used the triple EMA crossover (9-18-50). It also takes both sides of the trade. Disappointingly, it lost more than it won so I decided abandon it and used another system(buy above high-sell below low) which also failed miserably. lol.
Anyway, I started asking myself why the triple EMA crossover didn't work in FX while it worked and showed profitable results in the stock market. Then it got me thinking that I have to be on the right side of the market. With that in mind I decided to "zoom out" and check for 50EMA in longer time frames and trade with the 50EMA trend.
Got really tired so I decided to call it quits.
Lost 400USD using both systems in a 5000USD account(8% of capital).
Lesson: Trade with the trade. Don't take unneccessary trades. Sit tight when winning and set trailing stops. Don't be too eager to trade/wait for the right setup.
Day 3
I probably had the best trade today so far as I was able to gain $$50 above my starting capital haha. I lost it anyway when I started doing what I was doing in my first 2 days of FX trading. After losing the $$50 that I gained, I lost another $200 when I deviated from today's trading plan. After I reconized my own stupidity, I decided to FINALLY follow my trading plan LOL. So, I took the next trade and I was up by $200!!! But then I got really greedy I didn't put up a trailing stop! LOL!
So what do you expect from a pig other than get slaughtered?
Lesson: Don't be a pig and set trailing stops. Trade with the trend.
Let's see if I can break-even tonight. Currently short on EUR/USD.
*Trade setups. Trade with trend. Trade with trailing stops.
**I also tried selling lower and buying higher but both failed miserably. I probably should use them with the 50EMA.
***Currently using the triple EMA crossover in 1-minute chart + 50EMA on the 30-minute chart. Entry points are more often retested than not.
Thursday, June 9, 2011


Wednesday, June 8, 2011
AGI: Short term rally targets
AGI initial short term target hit 10.30(10.31).
Next 10.63
Best case 11.10
Next 10.63
Best case 11.10
Tuesday, June 7, 2011

AGI
The reasons why I didn't come scampering to this stock when it gapped down are:

1. Gap down from support.
2. Triple EMA breakdown prior to the gap.
3. Close below 11 as it completes the H&S pattern that formed
(AGI analysis dated Jan 19 http://the-morningstar-option.blogspot.com/2011/01/alliance-global-group-agi.html#comments).
Had you faded the gap, the best you could have gotten from the trade is 5.94%. That is if you got the exact low and high of the leg.

However, it appears to be forming a bullish RSI divergence on the daily chart. A close higher than today's closing will confirm the bullish divergence, suggesting a short term rally to 10.31 up to 10.63 and 11.10 as the best case scenario.
It could rally, it could not and I am not willing to place my bet on this one.
Also, the minimum short term target isn't enough to justify the trade so I wouldn't touch this one yet.
I'd wait for a bullish RSI divergence on the weekly charts in the mean time.
To the next trade!
RFM: Capitulation(?)
Daily Chart:
Capitulation? Long black candle with spike in volume suggests panic selling. DMI(ADX) value has also reached the highest in the last six months. RSI value has also reached its lowest in the last six months.

However, despite of observations, I believe that it would be better to watch price action to stabilize first before taking any actions such as bullish divergence on daily and weekly charts and/or sideways breakout.

RSI has dropped below 30 on the weekly chart suggesting a parabolic drop is probably in the works.
Capitulation? Long black candle with spike in volume suggests panic selling. DMI(ADX) value has also reached the highest in the last six months. RSI value has also reached its lowest in the last six months.

However, despite of observations, I believe that it would be better to watch price action to stabilize first before taking any actions such as bullish divergence on daily and weekly charts and/or sideways breakout.
Weekly Chart:
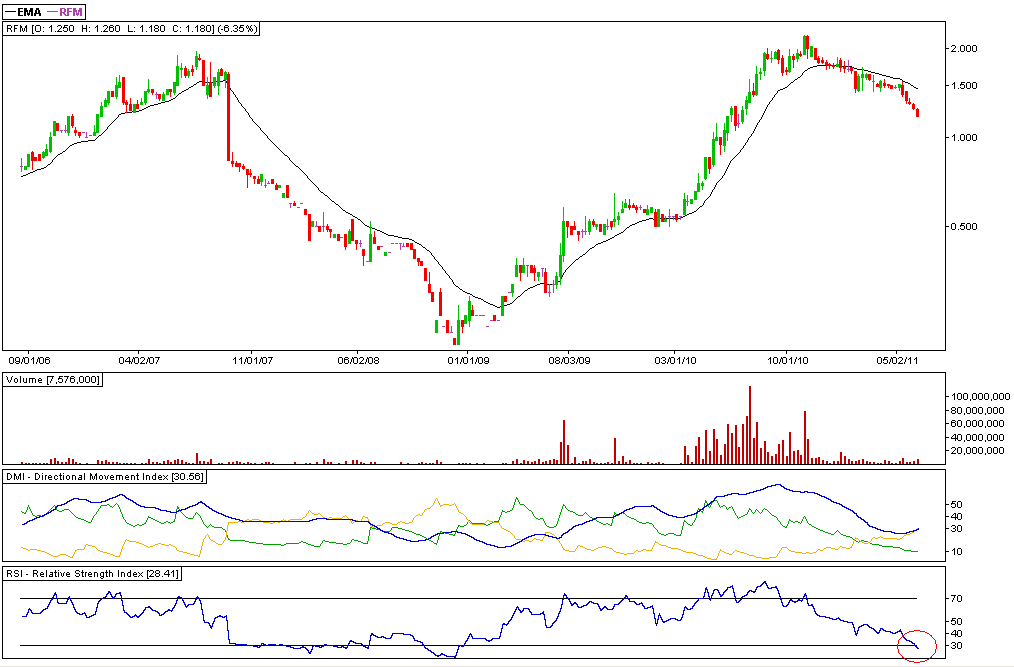
RSI has dropped below 30 on the weekly chart suggesting a parabolic drop is probably in the works.
Trading plan: Watch the circus. Sell rallies to 20EMA.
Increased position in PX. Average of PX holdings are now stuck at the middle of the tight trading range. Target still intact, just waiting for the breakout to happen.
LC bounced off support but met resistance at its WPP. LCB hardly retraced to its breakout point. LCB has better price action.
Attempting to predict LC top for tomorrow: 0.97.
URC seems to be forming a flag/pennant. Buying pressure appears to be building up.
AGI forming a bullish divergence on the daily chart? If yes then it could probably yield a 10% gain from its new trough(none as of this writing).
Not much issue to trade with, except for mining issues and other selected issues.
Didn't touch PWR, still unfamiliar with parabolic moves. Too scared to be the one left holding the empty bag.
P1 cash div in DMC, ex-date on the 10th of June. Yield is 2.41% using the recent close(41.40).
I'm liking the 5-minute divergences. I still need more practice!
LC
Bullish divergence on the 5-minute chart

Since the last bearish divergence produced a 10% drop, I am going to assume that this bullish divergence will produce a 10% gain(at most) with an average of 4.5% gain for the mean time.

Since the last bearish divergence produced a 10% drop, I am going to assume that this bullish divergence will produce a 10% gain(at most) with an average of 4.5% gain for the mean time.
Monday, June 6, 2011


Buy stop in LC @0.89 didn't get hit today.
Juicy bullish divergence in LCB?
New positions in PX did pretty okay as PX close higher @20.80. It was only pushed up on the closing though. Still have unfilled buying orders.
Add on 20EMA pullback(daily and/or 5-min)?
Got trapped in LPZ so I decided to close the LPZ position despite the bullish divergence on the 5-min chart. Daily RSI just made another lower low, enough to warrant a sell, so I sold it for a small loss. Proceeds were used to buy PX.
AGI seems to be forming a bullish divergence. The only reason why one should avoid this is because it is in a steady downtrend.
It feels like 5-min divergences are pretty good in predicting intraday/short term swings. I only need to know where to take profits.
Still keeping my eyes on mining/momentum.

Friday, June 3, 2011
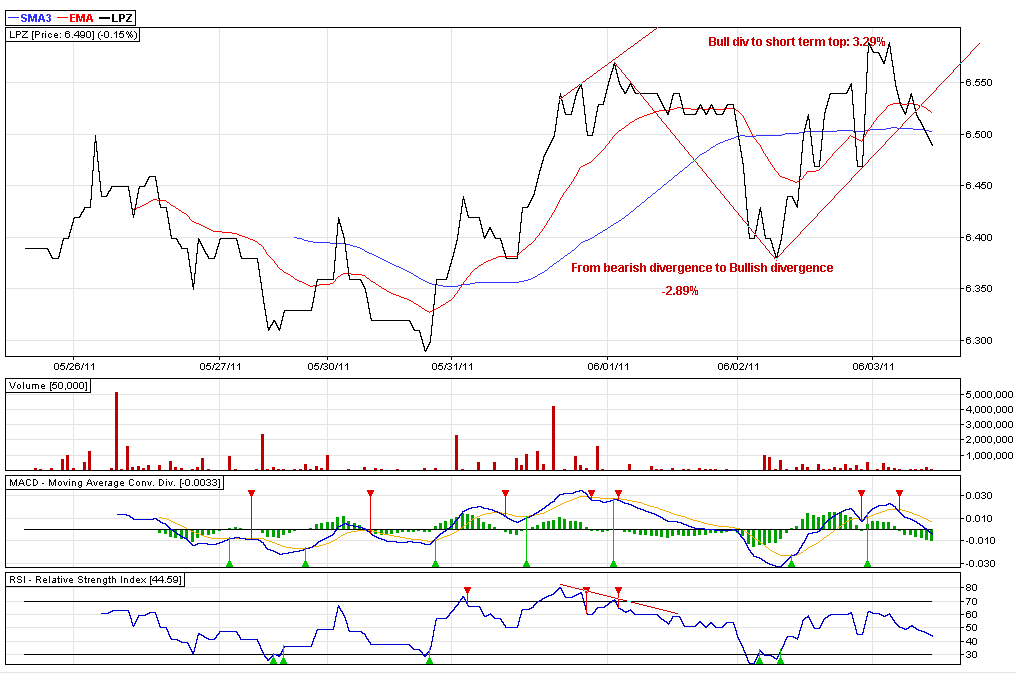
Breakout! - Not!
LC daily chart:

RSI is the give away here. But with LCB:

RSI looks pretty strong as it broke past 70!
Volume is very good too!
WHY?????!!! /wrist
*On a personal note, weekly charts appears to be bullish.

RSI is the give away here. But with LCB:

RSI looks pretty strong as it broke past 70!
Volume is very good too!
WHY?????!!! /wrist
*On a personal note, weekly charts appears to be bullish.
My assumption with 5/10 min divergences(tested on LC) is a bit off by 0.01(1 fluc) as it closed lower at 0.91.
Does it really work that way or I just got lucky today? Need more test.
PX bounced off WPP/MR2(20) today but it looks like it is going to open lower by next week.
LPZ broke down from its 5-min trend line confirmed by RSI. Spread is still pretty wide. I should have placed my sell order @6.58 today. Looks like I'm going to be stuck in a triangle.

LC
So I asked around the local "trading" forum about how many points does a bearish divergence found in 5/10 min chart costs. So far, nobody has replied yet. It appears like there are less people trading using intraday charts.
I'll just make my own research then.
LC 5-min chart:

How low will you go?
I'll just make my own research then.
LC 5-min chart:

How low will you go?
Thursday, June 2, 2011

Chasing momentum
Sold 25% of LPZ position @ 6.54 for a mere 1% profit.
Sold all URC for commision loss + 0.4% loss.
Proceeds from both position were used to buy back PX. Calculated breakout entry is 21.15.
LPZ was pushed up at the closing, giving my position some superficial gain.
LC closed on high. Second day after breaking out.
LCB broke past 1 already.
Breakout buy seems to be working pretty nice.
"Buy stop",(calculated from last month's MPP,)for MER @257 was "hit" today. Unfortunately, I wasn't really watching it. It looks good now nonetheless as volatility and trading range is above average.
I was scanning the market last night for possible trades using RMO.
It gave buy "above-high" signals for Industrial and Mining-O indexes.
Same signals were found in LC and PX. On the other hand, I was thinking what possible play from the Industrial index. It never came to me that MER is under the Industrial index. Stupid me.
The All-shares index was also given by the system a buy-above-high signal.
A broad-base rally perhaps?
By the way, I heard that the US and EUR markets broke pretty bad last night.

Wednesday, June 1, 2011
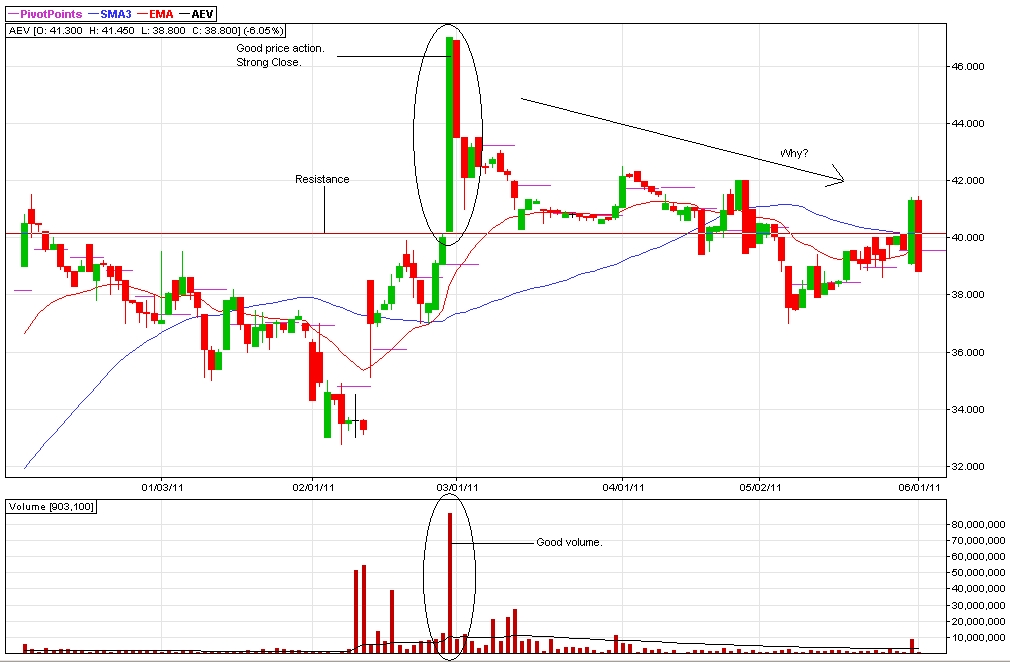
Breakouts and volume
It has been customary that a breakout needs a strong close accompanied by good volume.
But how about this:


So is it really worth it to wait for breakouts with "very good" volume?
Would be buying on breakout on "mediocre" volume better?
GERI appears to be an exception to the group as the fundamental reason why it was rising was pretty obvious to the public.

But how about this:


So is it really worth it to wait for breakouts with "very good" volume?
Would be buying on breakout on "mediocre" volume better?
GERI appears to be an exception to the group as the fundamental reason why it was rising was pretty obvious to the public.

The hell is wrong with ICT and AEV.
Almost ceiling by PWR. No sellers at ceiling price though, probably trying to avoid investigation if price hits the ceiling.
AGI gap almost filled.
AP range trade.
DMC moving to fill the gap?
GERI closed at resistance level?
JGS bounced off 20EMA.
LC second day closed above 0.88. Breakout buy if close >0.89.
LCB look for minor pullback to 0.94.
MA momentum picking up despite 126 sells?
MEG look for a double bottom/failure swing low setup.
MER range trade? Wasn't really watching it but price spread probably is wide.
Place buy stop 240(?) and sell @250(?).
RFM is still on a steady downtrend. Looking forward to a steep drop.
SMC RSI buy signal today. Resistance @120?
SMDC range trade?
URC moving in boxes? If yes then close > 44, target = 46.
Tuesday, May 31, 2011
Market closed lower courtesy of TEL and ICT.
TEL looks ok for range trading but range is pretty small too (+/- 5%).
Today's action looks overly bearish.
ICT. Well, I dunno what's going on here. The MSCI inclusion issue perhaps? Looks like range trading too. 4% up, 4% down. Anyway, I am trading issues with more upside bias.
TEL looks ok for range trading but range is pretty small too (+/- 5%).
Today's action looks overly bearish.
ICT. Well, I dunno what's going on here. The MSCI inclusion issue perhaps? Looks like range trading too. 4% up, 4% down. Anyway, I am trading issues with more upside bias.
Sold my position in LC with the highest aep @0.86. LC closed today @0.89. =(
Proceeds used to buy LPZ. Position in now up from break-even level.
Free cash used to buy URC. Position is also up.
My previous analysis for LC is if closing price is higher than 0.88, it could propel the prices somewhere around 0.98. However, 121(MACQ) seems to pushed the price up at the closing. Breakout entry also says buy if close is higher than 0.89. Let's see.
LCB second day close above previous high(0.94). Breakout entry says buy if close is higher than 0.94.
Missed CEB. Today is probably the start of a new upswing. Daily up, weekly up. No reason not to go long.
Volatility back in BEL and GERI? LR is the weakest among the group.
Volatility is also back in AEV. Not really watching them lately. My attention was range trading mining issues.
Range trade AP. Range is ok but a little tight though. +/- 6%. Drop back to 28 can?
Look for a pullback-entry in EDC? 50EMA pullback perhaps?
Good thing I sold PX yesterday after that ugly-as-fuck candle pattern. Let's see if 20 holds as support. Gap @19.36-19.26. Gap filled: Good. Gap not filled: Better.
Monday, May 30, 2011
Saturday, May 28, 2011
CEB
My initial reading suggests a pullback to around 90(weekly basis) after breaking out to warrant a buy although I wasn't expecting it to drop up up to the current level.
But it did:

It retraced to 61.8% Fib levels. Nonetheless, it provides a relatively good short term upside at current levels up to the recent high of 98.
All we need now is positive(weekly/daily) momentum.
Confirmation of move this week:

Even if this is just an A-B-C correction(in a downtrend), you'd still have one profitable leg/trade.
Friday, May 27, 2011

Universal Robina Corp (URC)
One crazy idea:

It was suggested that the wave 3 is the longest wave. If I recall it correctly, wave 3 is like x2-x3 of wave 1.
Please take note that I do not practice Elliot wave theory, thus this is just one crazy idea that I have.

It was suggested that the wave 3 is the longest wave. If I recall it correctly, wave 3 is like x2-x3 of wave 1.
Please take note that I do not practice Elliot wave theory, thus this is just one crazy idea that I have.
Trader's Toolbox: Reversals
Rules to mark a reversal high:
1. The market must make a new high for the last six to eight weeks.
2. The market must close lower than the previous day’s (or week’s) close.
3. The market must reverse the previous day’s (or week’s) action.
From CLUB.INO.COM. Original post linked on the title.
1. The market must make a new high for the last six to eight weeks.
2. The market must close lower than the previous day’s (or week’s) close.
3. The market must reverse the previous day’s (or week’s) action.
-To clarify rule three, the day or week preceding the reversal must have posted a positive close.
4. The market must post follow through action the next day (or week).
-To clarify, the market must close lower on the day (or week) following the reversal.
5. Fifth, the reversal must be accompanied by moderate to high volume. And, finally, the reversal must occur in a terminal (critical) area.
5. Fifth, the reversal must be accompanied by moderate to high volume. And, finally, the reversal must occur in a terminal (critical) area.
From CLUB.INO.COM. Original post linked on the title.
Philex Mining (PX)
Broke into a new 52-week high (on a Friday).

My initial entry is @19.22(1) but I decided to sell 60% of the position(2) that resulted -0.06% of capital as the price of LC that day looked pretty attractive.


My calculated breakout buying price is @20.03.
However, RSI is relatively weaker vs price with bearish RSI divergence which are bugging me so I am keeping a tight trailing stop for the meantime. Long white candlestick accompanied by huge volume suggests a short term overly bullish sentiment.

My initial entry is @19.22(1) but I decided to sell 60% of the position(2) that resulted -0.06% of capital as the price of LC that day looked pretty attractive.
Position is now up by 4.65% from adjusted entry price.
Looking closer at the 5-minute chart:

MACD bullish divergence was seen on the 5-minute chart but the price reversed only after RSI divergence.
Crazy juice flowing on the weekly charts:

Pullback after breakout(red circle) from symmetrical triangle pattern with (+/-) 22 as target.
RSI historical resistance 86.
It took 14 weeks to resume its uptrend after breaking out which is kinda hard to time. lol.
Maybe I can (much later on)when I get better in trading.
Thursday, May 26, 2011
Wednesday, May 25, 2011
Sold(cut-loss) half PX @19.66 earlier today. Remaining position break-even level is now up @20.
Proceeds used to buy additional LC @0.81.
Free cash used to buy additional LC @0.78.
Only 1 losing position in LC, bought @0.85.
I'd probably lighten up somewhere 0.90+ but if this one closes higher than 0.88, I'd probaby hold for the meantime.
AGI broke down/gap down and closed below support @11.
DMI sell signal on daily and weekly chart.
wRSI broke down.
Triple EMA breakdown.
Pattern breakdown target: 9.12.
Medium term support: 10.
AP weekly 50MA/Pattern support: 27.
wRSI broke support.
AT Range trade. Trading range 16-18. Possible trend candidate. wMACD Buy signal.
CMT support 1.20.
LCB possible doji setup.
LR possible doji setup.
MA gap support @0.039 held(?)
MER MPP possible penetration. Buy stop @257.
PX weekly reversal pattern. wRSI sell signal. Watch price movement at wRSI support.
SMDC range trade. Trading range 8.50-9.50.
SMPH breakout candidate. Normal resistance @12. Trading range 11.50-12.
URC WPP buy signal.
PSEi is bearish. New RSI low but index is still not making new lows.
All shares index looks like holding up(RSI support).
Financial sector is forming successive lower RSI highs(bearish divergence). DMI sell signal today.
Holding sector is forming successive lower RSI highs(bearish divergence) and currently trending down but trend strength is starting to pick up.
Industrial sector is holding up(RSI support) but currently trending down and trend strength is starting to pick up.
Mining sector is holding up(RSI support) with a possible short term reversal play(doji setup).
Property sector appears to be in a weak downtrend.
Service sector appears to be in a weak downtrend.
