Thursday, December 2, 2010

Trade Setup: AP - Status: Open


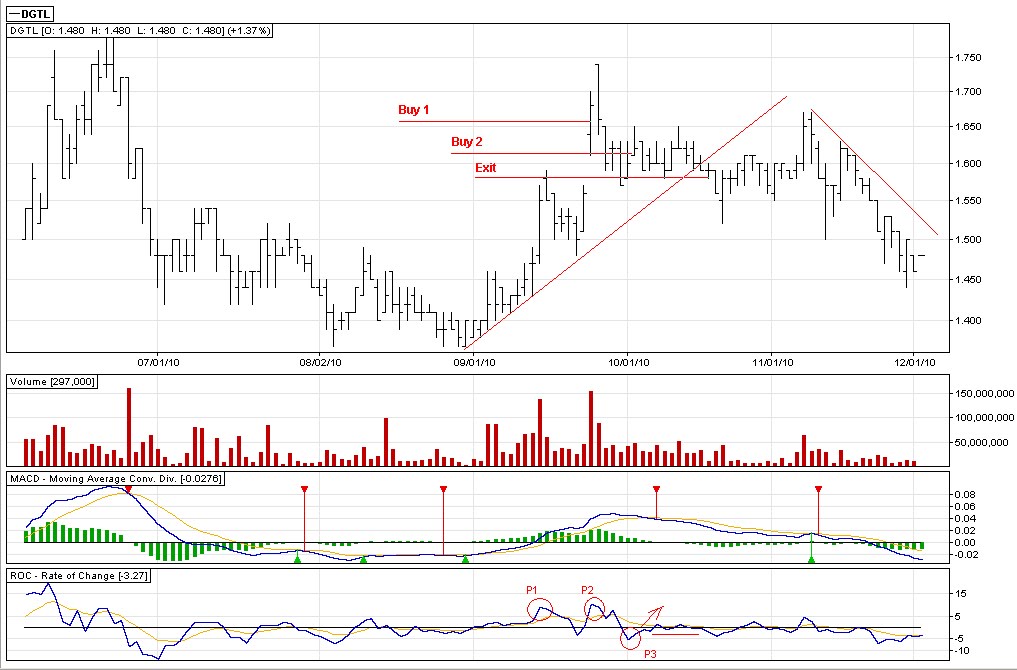
The red box indicates where I initially believe that the price will head back down again as it broke down from its support - which I believed it should not so I didn't buy yet. However, I was wrong in my analysis that time so I decided to be on the right side of the market: Buy and go long.

B1 = First set of buying was staggered: First part was done @25.85. The buying during the entire session was strong I decided to chase it and got the second part @25.95.
It closed at 26 - the buying of the stock was immediately proven right as it immediately showed profits.

B2 = Second set of buying was also staggered: First part was done @28. The buying during the early part of the session was strong so I decided to chase it and got another set @28.25. However the buying was unsustainable, and it closed lower at 27.90, indicating that the timing of my buying that day was terrible. I let it run though as the reason for buying that day was still valid.

I was trying to buy a cross over of price below the 10SMA. However, price never dropped below it so I bought as close to 10SMA as possible.

Earnings report is the other reason why I took position.

Initial personal target price was 35. However, personal tp was reached and breached today so I am extending my holding period further because two foreign brokerage houses bought a large amount of shares on the market.

ATR buying: The day ATR buying was evident.
Deutsche buying: The day Deutsche buying was evident.

ATR buying has also formed a hammer candlestick(bullish indication) and price opened below the 10SMA but closed higher. It should have provided a good entry for a short term trade - if you weren't too afraid to buy.

The red circle on the MACD suggests a short term take-profits signal.

The red asterisk on the rate of change would suggest short term peak.

TOP 20 Buyer-Seller:


The image of the top buyer/seller is to see who's getting in and who's getting out within this past 3 days.

General trading plan: Sit tight and let the profits run wild.
Lesson in this trade: Averaging up works; always buy what's showing strength;
and don't be too quick to take your profits. :)

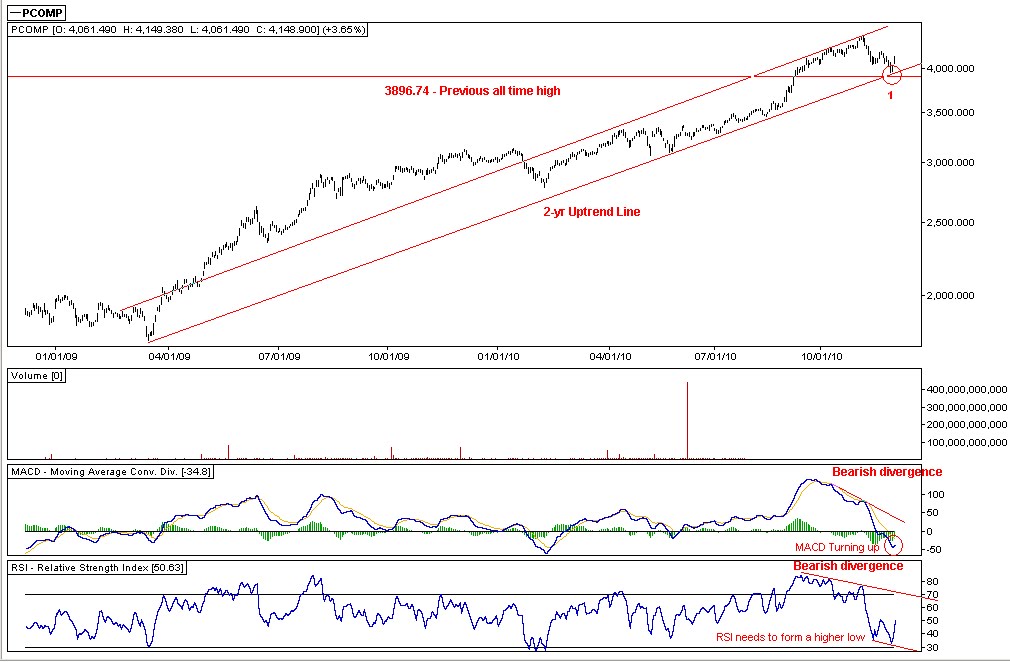
The big question: Will AP continue to advance in the short to medium term?

Well, you wouldn't know until you bet.

So, are we there yet?

The market bounced strongly today, gaining 146.02 points, closing higher by a whopping 3.65% at 4148.90. Looks like we did find a bottom yesterday:


The market bounced from the 2-year uptrend line(1) which I believe the major uptrend line. RSI needs to form a higher low to indicate the strength/bullishness of the trend.

Looking at the PSEi weekly chart:


As we can see, the crossing of the faster line below the slower line(MACD - red cirlce) indicates that the recent decline in the daily chart is simply a correction and RSI is still normal - meaning no bearish divergences or what so ever is visible on the chart as of this moment.

We can conclude from this that the uptrend is still intact - for the mean time- up until the current uptrend line is broken.

AP. AP. What can I say? Nothing much as it is simply heading up after our foreign friends started to gobble up alot of shares in the market and I highly doubt that they would let the price fall below their entry.

AP gained a nice 7.51% today and the most active stock today while AGI is the second runner up.

Technically speaking, I have a screaming take profits signal for tomorrow for short term trading. As of now, I am trading AP for intermediate term already. My personal target of P35 has been already reached and breached so I am simply letting my profits run and go wild now.

AGI is looking to break out from its ascending triangle chart pattern pointing at 15.24 as a possible target although I think that my system will generate a take profit signal within 2 days but our foreign friends has also gobbled up a lot of this stock so let's see what's going to happen.

No short term trades for me as of the moment as I am trying to lessen the stress when trading.

Current position:


Within 28 trading days.

Sucker Play 101: DGTL

Here is a previous trade that went sour:


Buy 1: Bought it first at 1.68. My reason for buying it was the gap, that was pointing to 1.89 as an immediate target. However, the next day, it reversed closing lower and now pointing to fill the gap but I was being stubborn that time so I held to my position thinking it would be quick to rebound the next round.

Buy 2: Bought another set at 1.63 thinking it was the bounce that I was waiting for. However, just like the first trade, it reversed immediately the next day. The reason behind this second set was (1)I thought it was the bounce that I was waiting for; (2)Rate of change has started to point up suggesting an upswing in the short term - believing that it will reach the previous peak at P2; and the last but the most fatal error one could make in a trade: (3)Read on a forum that Abacus(brokerage) was accumulating because it has a "very good" earning report that is coming out come 3Q earnings report - which was also magnified by another guru saying that DGTL story is a turnaround story.

After 9 trading days, the uptrend line was broken so I decided to take the hit and cut loss to preserve capital and to avoid further loss in trading opportunities. I sold both positions 1.69 and 1.64 at 1.59.

The trade averaged a 6.84% loss to the entire trading capital.

Conclusion:

If I didn't take the hit and sold the entire position, I would still be incurring further losses as it continued to decline further up until now and I would have missed a very profitable trade that I have which is still open(Aboitiz Power).

Lessons from the trade:


(1)Never trade without a plan.
(2)Never make a plan after reading other people's analysis on a certain stock.
(3)Never trade on a tip. When there's a tip, there's a tap.

So the big question now: Is DGTL a turn around story? See it for yourself.

Don't be a sucker.