Friday, June 3, 2011

Breakout! - Not!

LC daily chart:


RSI is the give away here. But with LCB:


RSI looks pretty strong as it broke past 70!
Volume is very good too!

WHY?????!!! /wrist


*On a personal note, weekly charts appears to be bullish.
My assumption with 5/10 min divergences(tested on LC) is a bit off by 0.01(1 fluc) as it closed lower at 0.91.

Does it really work that way or I just got lucky today? Need more test.

PX bounced off WPP/MR2(20) today but it looks like it is going to open lower by next week.

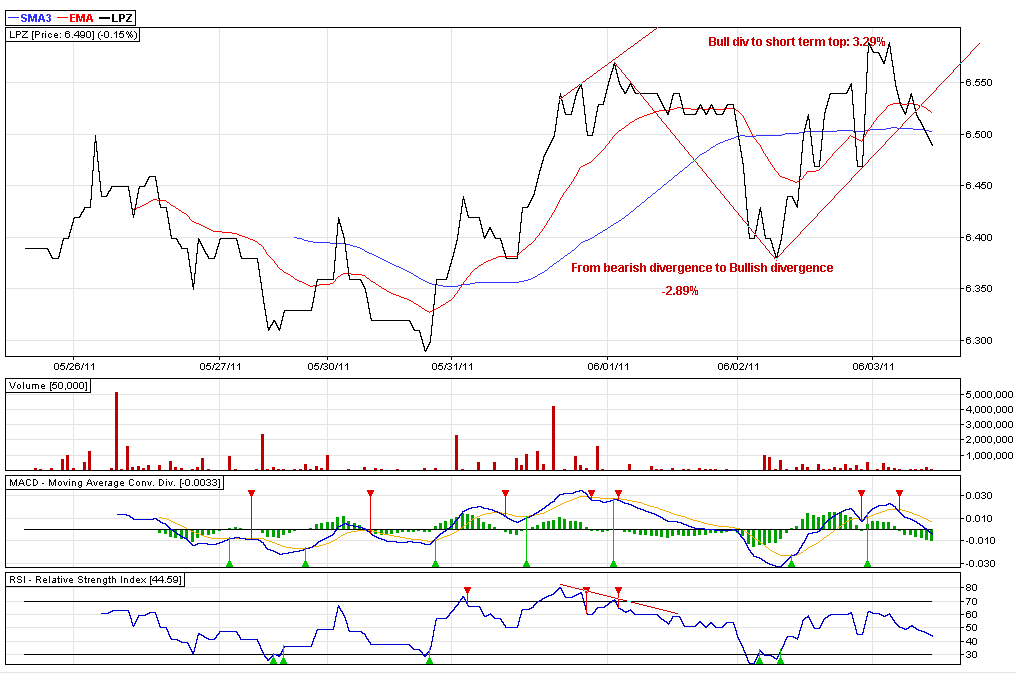
LPZ broke down from its 5-min trend line confirmed by RSI. Spread is still pretty wide. I should have placed my sell order @6.58 today. Looks like I'm going to be stuck in a triangle.
PX bounced off WPP/MR2(20). Looking to open higher next week?

LPZ

5-minute chart: Bearish divergence - bullish divergence:

LC: Bearish divergence on 5-min chart

Will you drop?

LC

So I asked around the local "trading" forum about how many points does a bearish divergence found in 5/10 min chart costs. So far, nobody has replied yet. It appears like there are less people trading using intraday charts.

I'll just make my own research then.

LC 5-min chart:


How low will you go?