Missed the breakout in MA. Damn.
Panira sa trading ang pag-aaral!
Wednesday, July 13, 2011
Tuesday, July 12, 2011
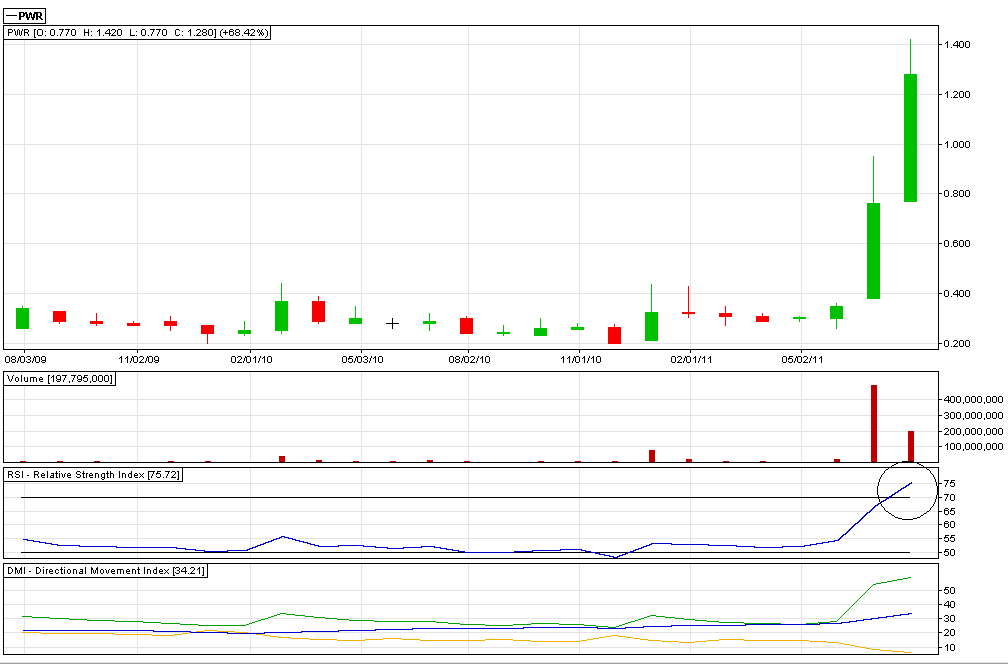
PWR: Enter Parabola
Entered the 70 RSI levels on the daily chart today, closing slightly higher than its second weekly resistance(1.26):

However, prices have dropped below the 70 RSI levels on the 5-minute chart:


However, prices have dropped below the 70 RSI levels on the 5-minute chart:

Weakness on the 5-minute chart chance to average up since the bigger time frames are bullish? RSI confirmation once it bounces off the 50 RSI levels.
Meanwhile, it has entered the 70 RSI levels on the weekly chart today, closing slightly higher than its second weekly resistance(1.26):

While staying afloat in the 70+ monthly RSI levels the entire time:

MR3: 1.58
Meanwhile, it has entered the 70 RSI levels on the weekly chart today, closing slightly higher than its second weekly resistance(1.26):

Flag pattern target(breakout point: 0.88): 1.55
While staying afloat in the 70+ monthly RSI levels the entire time:
MR3: 1.58
Monday, July 11, 2011
Saturday, July 9, 2011
PSEi
The index pulled right back after reaching its secondary monthly resistance(2) after breaching the monthly pivot point(1) which was also confirmed by the RSI bouncing-off(3) the 50 level.

For the upcoming week, the index needs to close higher than 4400 to continue the upswing with 4500(4514) as a potential target/resistance. Anything higher than that could mean a steep climb, with RSI confirming hopefully, and 4500 could turn into the new support.
However, failure to break past 4400 could ruin the bullish sentiment and the index would probably land at 4300(4290) this week.
Index level is also bearishly divergent to previous high(lower RSI from previous high).
Trend strength appears to be relatively weak as suggested by the DMI reading(not picking up).
Gold ($GOLD - Continuous Contract) + FX: Trial by fire
I am baffled with my stupidity in my trades this week(in GOLD and in EURUSD), but so far, none of previous mistakes can top my stupidity in GOLD this week!
Here's the reason why:

Okay, so far, my mistakes came from putting on too tight stops(trailing/loss) so I am going to trade with no stops this week. Let's see how terrible the outcome will be.
Anyway, moving on, enough with the sour-graping, Gold pretty much looks like sideways with a slight downward bias, looking to pullback to the 200 MA which should provide a relatively safe entry with excellent upside potential plus the fact that it could break into a new high:

Trade with bigger volume on the long side on the 200SMA pullback setup:

Wednesday, July 6, 2011
FX: Trial by fire
I am annoyed as hell today as my technically sound logic of shorting EURUSD today went "unprofitable".
This picture best describes what happened:

Missed 120 pips of profit on 20k units or $246. That trade could have made the week. Imagine if that was real money.
/ragequit
This picture best describes what happened:

Missed 120 pips of profit on 20k units or $246. That trade could have made the week. Imagine if that was real money.
/ragequit
Tuesday, July 5, 2011

PSEi: Heading towards new highs?
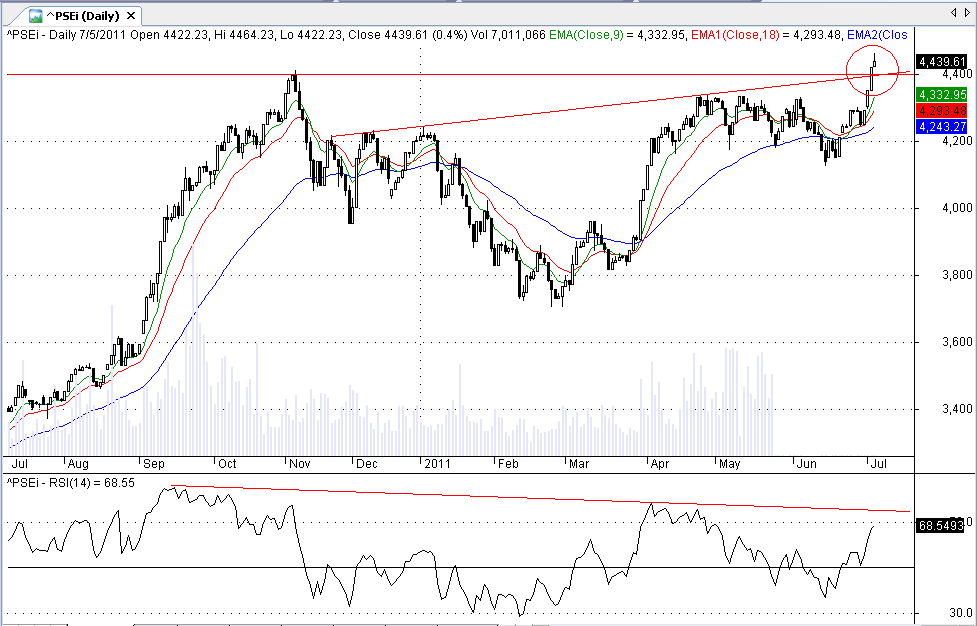
Obvious bearish divergence. If divergence is still present after 3 pushes to its high, take profits.
I am expecting a short term correction after breaking out of:
1) previous resistance - 4413
2)inverted head and shoulder pattern - target: 5095 (695 points); however, the pattern is too big to be deemed accurate so the index would either fall short or overshoot the target;
bulls are hoping to overshoot the target so everybody would be happy.
Breakout seems legit as the accompanying volume is exceptionally high(7+Bil TO) today
As for the short term correction, I am hoping for a shallow one so there would be more steam for the next leg.
Index weekly:

Monday, July 4, 2011
Wednesday, June 29, 2011
Thursday, June 23, 2011
Calculated breakout entry for PX is at 21.01 but RSI is not confirming any breakout. Pretty wide trading range 18-21 for the mean time.
Calculated breakout entry for AT is at 20.75. But at the current rate of ascent, the price appears to be the short term peak. Look to position at the second gap(19-19.24).
Calculated breakout entry for AT is at 20.75. But at the current rate of ascent, the price appears to be the short term peak. Look to position at the second gap(19-19.24).
Wednesday, June 22, 2011
LC/B barely moved today while AT and PX jumped with 4+% gains. I think PX will enter a parabolic run when it closes higher than 21.75.
Issues that are lingering just above 50SMA are ICT, MBT. NIKL appears to be forming a base.
The index appears to be at its immediate resistance(50SMA+50RSI).
Not much interesting moves on the PSE so I am still practicing on trading FX(EURUSD and XAUGLD pairs) on my free time. I still get frustrated from time to time as I continually forgets my basic trading rules :))
Forex trading appears to be more promising nonetheless if done properly. There would be no more need to wait for quarterly earnings report.
I asked around again the local forums with regards to forex trading. Let's see who would even bother answering :))
I think Gold($GOLD) is preparing to challenge the 1574 levels again in the short term. Think long!
Tuesday, June 21, 2011
TEL: Divergence
Divergence: Deal or no deal?

The only thing that disturbs me with TEL is the flat price action in between divergences, inclining me to believe this action as a fake one.

The only thing that disturbs me with TEL is the flat price action in between divergences, inclining me to believe this action as a fake one.
I am having trouble seeing what's real with all the superficial closings last week.
No meaningful moves with LC/B while most of the oversold issues rallied today.
LC is being slightly bearish on the 5-min chart while LCB is slightly bullish on the same time frame.
This might suggest further consolidation in the short term. Still waiting for a rally with huge range/bearish RSI divergence.
AT broke and closed above its box resistance @18, looking forward to 19.50 as a short term target.
MEG rallied(DCB?) off its MS1 today. Short term target @2.14 levels(MPP and 50EMA).
Most of the gainers today, I cannot read.
Started another FX demo account with US$3k. Applying proper stops and money management now after turning a winning trade with the previous account into a loser.