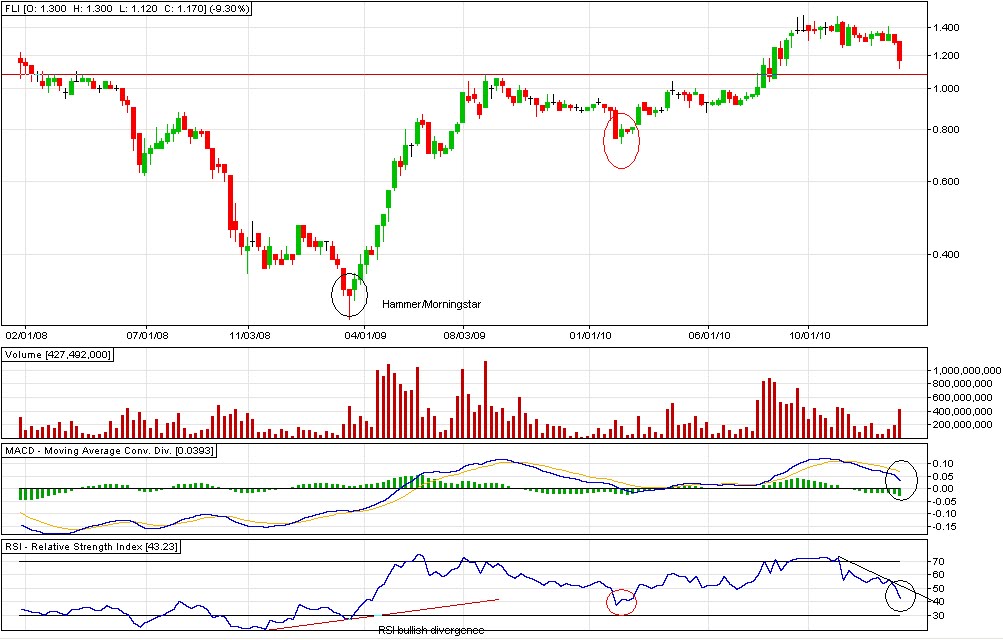
The setup that I will be looking for before putting up position in FLI is a setup similar with the red circle, an sign of recovery in RSI after the huge drop pointed out by the bearish divergence in RSI.
We already have the huge drop in play. Waiting for sign of recovery. Profit taking would be somewhere at 53 RSI.
MEG weekly chart:

Same game plan with FLI. RSI 35 would seem to be a good place to start catching falling knives. Looks like there is still possible downside in the short term.
Both have hammer candlestick formations. However, I have bad experiences with red hammers without confirmations so I am still not touching them until signs of recovery.
I am getting killed in MEG and FLI. Any prospects in the short term? Appreciate your input sir.
ReplyDeleteJudging FLI's price movement today, there could be a technical bounce in the short term but with the current bearish sentiment, I think it could only get to 1.23-ish.
ReplyDeleteMEG is looking to bounce already to 2.20 to 2.30 at most.
Hope that helps.