
Friday, June 3, 2011
LC
So I asked around the local "trading" forum about how many points does a bearish divergence found in 5/10 min chart costs. So far, nobody has replied yet. It appears like there are less people trading using intraday charts.
I'll just make my own research then.
LC 5-min chart:

How low will you go?
I'll just make my own research then.
LC 5-min chart:

How low will you go?
Thursday, June 2, 2011

Chasing momentum
Sold 25% of LPZ position @ 6.54 for a mere 1% profit.
Sold all URC for commision loss + 0.4% loss.
Proceeds from both position were used to buy back PX. Calculated breakout entry is 21.15.
LPZ was pushed up at the closing, giving my position some superficial gain.
LC closed on high. Second day after breaking out.
LCB broke past 1 already.
Breakout buy seems to be working pretty nice.
"Buy stop",(calculated from last month's MPP,)for MER @257 was "hit" today. Unfortunately, I wasn't really watching it. It looks good now nonetheless as volatility and trading range is above average.
I was scanning the market last night for possible trades using RMO.
It gave buy "above-high" signals for Industrial and Mining-O indexes.
Same signals were found in LC and PX. On the other hand, I was thinking what possible play from the Industrial index. It never came to me that MER is under the Industrial index. Stupid me.
The All-shares index was also given by the system a buy-above-high signal.
A broad-base rally perhaps?
By the way, I heard that the US and EUR markets broke pretty bad last night.

Wednesday, June 1, 2011
Breakouts and volume
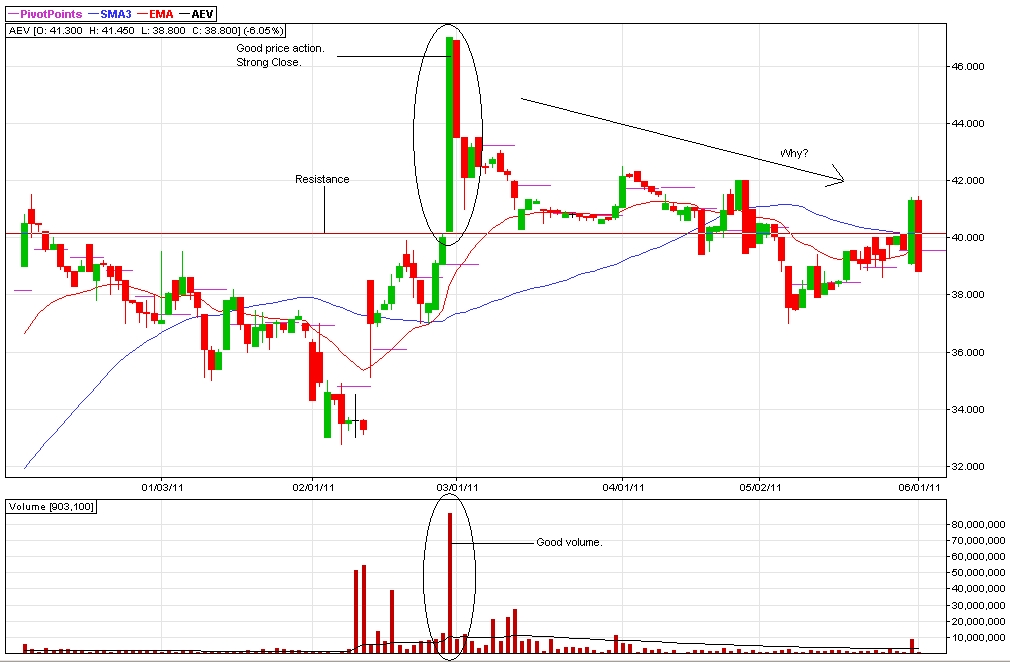
It has been customary that a breakout needs a strong close accompanied by good volume.
But how about this:


So is it really worth it to wait for breakouts with "very good" volume?
Would be buying on breakout on "mediocre" volume better?
GERI appears to be an exception to the group as the fundamental reason why it was rising was pretty obvious to the public.

But how about this:


So is it really worth it to wait for breakouts with "very good" volume?
Would be buying on breakout on "mediocre" volume better?
GERI appears to be an exception to the group as the fundamental reason why it was rising was pretty obvious to the public.

The hell is wrong with ICT and AEV.
Almost ceiling by PWR. No sellers at ceiling price though, probably trying to avoid investigation if price hits the ceiling.
AGI gap almost filled.
AP range trade.
DMC moving to fill the gap?
GERI closed at resistance level?
JGS bounced off 20EMA.
LC second day closed above 0.88. Breakout buy if close >0.89.
LCB look for minor pullback to 0.94.
MA momentum picking up despite 126 sells?
MEG look for a double bottom/failure swing low setup.
MER range trade? Wasn't really watching it but price spread probably is wide.
Place buy stop 240(?) and sell @250(?).
RFM is still on a steady downtrend. Looking forward to a steep drop.
SMC RSI buy signal today. Resistance @120?
SMDC range trade?
URC moving in boxes? If yes then close > 44, target = 46.
Tuesday, May 31, 2011
Market closed lower courtesy of TEL and ICT.
TEL looks ok for range trading but range is pretty small too (+/- 5%).
Today's action looks overly bearish.
ICT. Well, I dunno what's going on here. The MSCI inclusion issue perhaps? Looks like range trading too. 4% up, 4% down. Anyway, I am trading issues with more upside bias.
TEL looks ok for range trading but range is pretty small too (+/- 5%).
Today's action looks overly bearish.
ICT. Well, I dunno what's going on here. The MSCI inclusion issue perhaps? Looks like range trading too. 4% up, 4% down. Anyway, I am trading issues with more upside bias.
Sold my position in LC with the highest aep @0.86. LC closed today @0.89. =(
Proceeds used to buy LPZ. Position in now up from break-even level.
Free cash used to buy URC. Position is also up.
My previous analysis for LC is if closing price is higher than 0.88, it could propel the prices somewhere around 0.98. However, 121(MACQ) seems to pushed the price up at the closing. Breakout entry also says buy if close is higher than 0.89. Let's see.
LCB second day close above previous high(0.94). Breakout entry says buy if close is higher than 0.94.
Missed CEB. Today is probably the start of a new upswing. Daily up, weekly up. No reason not to go long.
Volatility back in BEL and GERI? LR is the weakest among the group.
Volatility is also back in AEV. Not really watching them lately. My attention was range trading mining issues.
Range trade AP. Range is ok but a little tight though. +/- 6%. Drop back to 28 can?
Look for a pullback-entry in EDC? 50EMA pullback perhaps?
Good thing I sold PX yesterday after that ugly-as-fuck candle pattern. Let's see if 20 holds as support. Gap @19.36-19.26. Gap filled: Good. Gap not filled: Better.
Monday, May 30, 2011
Saturday, May 28, 2011
CEB
My initial reading suggests a pullback to around 90(weekly basis) after breaking out to warrant a buy although I wasn't expecting it to drop up up to the current level.
But it did:

It retraced to 61.8% Fib levels. Nonetheless, it provides a relatively good short term upside at current levels up to the recent high of 98.
All we need now is positive(weekly/daily) momentum.
Confirmation of move this week:

Even if this is just an A-B-C correction(in a downtrend), you'd still have one profitable leg/trade.
Friday, May 27, 2011

Universal Robina Corp (URC)
One crazy idea:

It was suggested that the wave 3 is the longest wave. If I recall it correctly, wave 3 is like x2-x3 of wave 1.
Please take note that I do not practice Elliot wave theory, thus this is just one crazy idea that I have.

It was suggested that the wave 3 is the longest wave. If I recall it correctly, wave 3 is like x2-x3 of wave 1.
Please take note that I do not practice Elliot wave theory, thus this is just one crazy idea that I have.
Trader's Toolbox: Reversals
Rules to mark a reversal high:
1. The market must make a new high for the last six to eight weeks.
2. The market must close lower than the previous day’s (or week’s) close.
3. The market must reverse the previous day’s (or week’s) action.
From CLUB.INO.COM. Original post linked on the title.
1. The market must make a new high for the last six to eight weeks.
2. The market must close lower than the previous day’s (or week’s) close.
3. The market must reverse the previous day’s (or week’s) action.
-To clarify rule three, the day or week preceding the reversal must have posted a positive close.
4. The market must post follow through action the next day (or week).
-To clarify, the market must close lower on the day (or week) following the reversal.
5. Fifth, the reversal must be accompanied by moderate to high volume. And, finally, the reversal must occur in a terminal (critical) area.
5. Fifth, the reversal must be accompanied by moderate to high volume. And, finally, the reversal must occur in a terminal (critical) area.
From CLUB.INO.COM. Original post linked on the title.
Philex Mining (PX)
Broke into a new 52-week high (on a Friday).

My initial entry is @19.22(1) but I decided to sell 60% of the position(2) that resulted -0.06% of capital as the price of LC that day looked pretty attractive.


My calculated breakout buying price is @20.03.
However, RSI is relatively weaker vs price with bearish RSI divergence which are bugging me so I am keeping a tight trailing stop for the meantime. Long white candlestick accompanied by huge volume suggests a short term overly bullish sentiment.

My initial entry is @19.22(1) but I decided to sell 60% of the position(2) that resulted -0.06% of capital as the price of LC that day looked pretty attractive.
Position is now up by 4.65% from adjusted entry price.
Looking closer at the 5-minute chart:

MACD bullish divergence was seen on the 5-minute chart but the price reversed only after RSI divergence.
Crazy juice flowing on the weekly charts:

Pullback after breakout(red circle) from symmetrical triangle pattern with (+/-) 22 as target.
RSI historical resistance 86.
It took 14 weeks to resume its uptrend after breaking out which is kinda hard to time. lol.
Maybe I can (much later on)when I get better in trading.
Thursday, May 26, 2011
Wednesday, May 25, 2011
Sold(cut-loss) half PX @19.66 earlier today. Remaining position break-even level is now up @20.
Proceeds used to buy additional LC @0.81.
Free cash used to buy additional LC @0.78.
Only 1 losing position in LC, bought @0.85.
I'd probably lighten up somewhere 0.90+ but if this one closes higher than 0.88, I'd probaby hold for the meantime.
AGI broke down/gap down and closed below support @11.
DMI sell signal on daily and weekly chart.
wRSI broke down.
Triple EMA breakdown.
Pattern breakdown target: 9.12.
Medium term support: 10.
AP weekly 50MA/Pattern support: 27.
wRSI broke support.
AT Range trade. Trading range 16-18. Possible trend candidate. wMACD Buy signal.
CMT support 1.20.
LCB possible doji setup.
LR possible doji setup.
MA gap support @0.039 held(?)
MER MPP possible penetration. Buy stop @257.
PX weekly reversal pattern. wRSI sell signal. Watch price movement at wRSI support.
SMDC range trade. Trading range 8.50-9.50.
SMPH breakout candidate. Normal resistance @12. Trading range 11.50-12.
URC WPP buy signal.
PSEi is bearish. New RSI low but index is still not making new lows.
All shares index looks like holding up(RSI support).
Financial sector is forming successive lower RSI highs(bearish divergence). DMI sell signal today.
Holding sector is forming successive lower RSI highs(bearish divergence) and currently trending down but trend strength is starting to pick up.
Industrial sector is holding up(RSI support) but currently trending down and trend strength is starting to pick up.
Mining sector is holding up(RSI support) with a possible short term reversal play(doji setup).
Property sector appears to be in a weak downtrend.
Service sector appears to be in a weak downtrend.

Tuesday, May 24, 2011
FGEN
Good thing I checked FGEN's weekly chart despite the urge to buy after the four consistent pattern it was showing:
I think it's better to wait for weekly RSI 40 for the mean time.
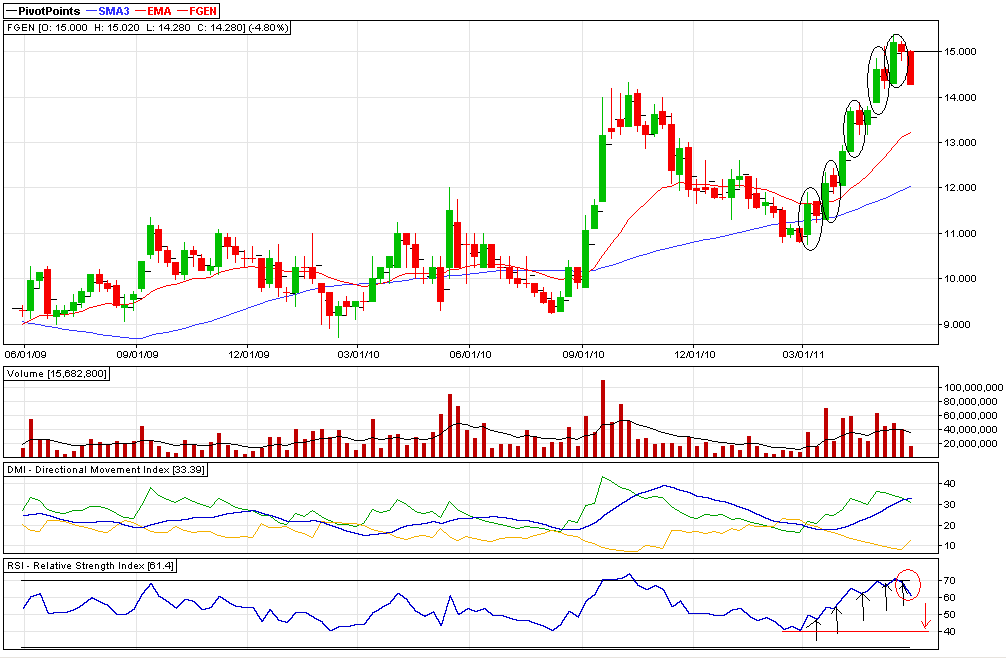
I think it's better to wait for weekly RSI 40 for the mean time.
I wasn't expecting the gap down today though.
Got stopped out in FLI @1.21.
I really thought that the 10-min downtrend in LC is about to end when it went the other way around today so I decided to place a barat bid @0.78 which didn't get hit today.
121 bought up alot of shares yesterday @0.85. 121 sold alot of share today @0.83.
I'd probably add some in PX tomorrow if it starts recovering by then.
Finally some volatility in AGI! I am really tempted to buy some earlier but I didn't. I would be waiting for a confirmation tomorrow but if AGI drops to 10.50 levels, I think I would jump on it. Bullish divergence on the 10-min chart suggests a short term bottom is just around the corner.
Or place a buy stop in BEL? Range looks pretty good and can be traded.
Monday, May 23, 2011
Today was rather boring although I think today would have provided some good entries to certain issues.
Issues that I am looking at this week are AT/BEL - range trading, PX/LC/B/URC - trending with LC/B/URC completing a 1-2-3 pullback setup and finally CEB for a pullback after a breakout setup.
I think LC needs to close higher than 0.88 to continue heading up.
Hopefully, CEB closes somewhere @90 this week to confirm my theory.
I am confused with URC's price movement. I am wondering if today's price action completed it's 1-2-3 pullback today. Lemme see my notes...
No idea what happened to MEG today.
I love small red candles. <3
Sunday, May 22, 2011
Manila Mining (MA)
Sometimes, I don't know if I am just having a bad break or simply being stupid when trading.
Here's one of the reasons why I stopped trading with candlesticks(well I still do trade with doji candles though):

A hammer followed by a bullish engulfing = $$ right? Not this time. Had you traded it that way, you are down by 6% or so in the trade already plus another 6% or so, depending on your position size while waiting for your stop to be hit.
Or maybe, I am doing it all wrong. Perhaps wait for the gap to be filled/position at the gap instead?
I'll toss a coin if I would place a barat bid at 0.036.
Friday, May 20, 2011
Thursday, May 19, 2011
Click here for the original post: http://www.investmentu.com
A Position Sizing Lesson: Why Size Matters to All Investing Greats
By Brian Hunt, Contributing Editor
Tuesday, May 25, 2004: Issue #340
I made four times my money in JDS Uniphase. But I made one mistake with JDS Uniphase: I didn’t put enough money into the trade, and picked up a valuable lesson on position sizing. It was early 2000, near the top of the bubble, and I was getting used to making 100%-plus returns.
Reading a popular investment newsletter, I fell for the hype surrounding another tech stock, LSI Logic but I wouldn’t make the same “mistake” I did with JDS Uniphase.
“If I’m going to make four times my money again, I’m doing it with over half my portfolio,” I thought.
But something awful happened on the way to the bank: Instead of soaring in value and making me rich, LSI Logic tanked. I was out $23,000 – more than I would even spend on a car!
The LSI Logic loss was brutal, and it wasn’t the only stock I lost money on. So I decided to make a big change. I couldn’t lose that kind of money again.
I left the markets for over a year to study to find out what professional investors do that I didn’t do.
Here’s what I learned…
Position Sizing is What the Pros Do that Novices Don’t
I made all kinds of mistakes starting out, like trying to make a quick buck and buying the most popular stocks but the biggest mistake was ignoring position sizing as a powerful investing concept.
It’s amazing how few investors even consider how much money to place into one investment. That’s all position sizing is the part of your investing strategy that tells you “how much” to place into any one investment.
Position sizing provides the answers to these questions:
- Should you place 10% of your money into one stock?
- How about 50% of your money?
What All Great Traders Have in Common
After taking several big losses in my account, I decided to learn from the greats. I read a book called Market Wizards, and discovered the world’s most successful investors used position sizing by putting only a tiny portion of their money (generally 1-2%) at risk on one idea.
I then learned the specifics of position sizing from the book, Trade Your Way To Financial Freedom, by Dr. Van K. Tharp. After studying thousands of successful traders, Dr. Tharp learned that every trader making millions in the market is fanatical about using position sizing to control risk.
Here’s How You Can Use Position Sizing in Your Own Portfolio
Let’s say you have $100,000 to invest and you’re using the 1% risk model to guide your investments. If you’re using a 25% stop loss, you could buy $4,000 worth of stock and risk $1,000 ($1,000 is 1% of $100,000).
In the example above, you placed 4% of your portfolio into the stock and set a 25% stop – risking just $1,000 of your money (since $1,000 is 25% of $4,000).
Some investors use even tighter stops, in the 10%-15% range.
If you’re using the 1% risk model with a 10% stop loss, you could buy $10,000 worth of stock. You have the same dollar amount at risk ($1,000) as the first example – but you’re allowing the stock less room to go down before you sell.
Now I use smart position sizing – and I never worry about taking big losses like I did with LSI Logic. Take a look at your portfolio today and make sure you know “how much” you have at risk. That way you’ll be prepared regardless of what happens with any one position.

Wednesday, May 18, 2011
Finance Manila: Trading Systems, Methods & Resources
Added a new link:
Trading Systems, Methods & Resources from Finance Manila (financemanila.net).
Lots of stuff to learn in the thread. Too bad it isn't sticky-ed on FM so I'll be keeping a link for a more direct access instead of digging it from the grave. Worth every time spent reading when one needs guidance.
Trading Systems, Methods & Resources from Finance Manila (financemanila.net).
Lots of stuff to learn in the thread. Too bad it isn't sticky-ed on FM so I'll be keeping a link for a more direct access instead of digging it from the grave. Worth every time spent reading when one needs guidance.
Haters gonna hate.

Despite my vow not to go/read forums anymore, I still did as I am bored as hell during trading sessions plus there's really nobody to talk to with regards to stock trading among my friends. Anyway, I am holding LC as my core position now so I frequent the LC thread in Finance Manila.
As I read the thread, I already felt that LC is poised for a heavy correction as majority of the posters are clamoring for a gap up to 1 while others are making calls for it to move to 1.20. As much as I do with everything, I ignored it and moved along. And so the correction came and so the bashers. I think yesterday was the worst day for LC as people started to dig up fundamentals again plus I really felt like bashing my head against the wall too lol.
Today it closed by more than 12%.
I think we can use the forums to use some of our trading decision too. As far as I have observed in the past, when people are clamoring for a gap up, it's time to sell. When people are bashing a certain stock - but with the exception of bash-plenty(is that even correct?) issues - it's time to sell.
Sold JGS for -2% of capital today @26.50 for PX @19.22. I still sold it despite the fact that negative momentum has slowed down/bottomed out already because positive momentum in PX has started to gain already. I am looking for a quick(a week) 10% in PX more or less.
FLI is up! Yay haha. Small position only. "GEO" fund.
DMI buy signal on SCC fyi.
See MA. Today was the confirmation that I was talking about right?
Tuesday, May 17, 2011
Manila Mining Corp "A"
I wanted to buy some MA earlier today but I was afraid lol.
Here are the reason's why I wanted to buy it:

RSI is resting at its support with negative ROC flattening out suggesting the correction is over.
Maybe I should have bought since I was feeling afraid lol. Anyway, confirmation of the next move is tomorrow.
Here are the reason's why I wanted to buy it:

RSI is resting at its support with negative ROC flattening out suggesting the correction is over.
Maybe I should have bought since I was feeling afraid lol. Anyway, confirmation of the next move is tomorrow.
Was thinking of selling JGS for a loss earlier today so I placed my sell order @25.85 but I pulled it out when I saw someone bought up to 25.60. Luckily, it closed @26 although still for a loss. I am starting to get traumatized by doji candlesticks at higher end of the trend lol.
Today is probably the worst day for DMC. -11.70% in one day just because it wasn't included in MSCI(unexpected)?
No way in hell for me to catch the move in ICT today. Will it continue to go higher? I have no idea but I hope it fades the gap back to 55 at least. It is trading another all time high though.
Bought some FLI today @1.25. Let's see how things go from here.
LC is breakeven. :((
Trading tools are back. My current system is for trending stocks, which sucks and prone to buy high sell low in ranging markets.
Monday, May 16, 2011


Sunday, May 15, 2011
JGS
So I have been looking to add up my position in JGS so I have been watching it all week. Last Friday, there was a bid of 1M shares @25.50. All of a sudden the bid got pulled out, closing with 250k shares instead which spooks me out. Although before the 1M bid got pulled out, I checked who's been buying all day: 209. All his selling are all from cross sales only so I think 209 is accumulating.
DMI reading suggests strong uptrend so I think buying on pullbacks on 9SMA or 20EMA can be applied to trade this one.
Pullback after breakout(26.55 - bounce) can also be applied for a better position.

Gokongwei stocks are definitely moving.
DMI reading suggests strong uptrend so I think buying on pullbacks on 9SMA or 20EMA can be applied to trade this one.
Pullback after breakout(26.55 - bounce) can also be applied for a better position.

Gokongwei stocks are definitely moving.
Thursday, May 12, 2011
Blow off setup?
MA(daily): Getting ready for a blow off?

LC(weekly): Same setup? Volume's half way there.


LC(weekly): Same setup? Volume's half way there.

Two consecutive fake buy signals in a row, yesterday was EDC and today in NIKL. Not that they hit my stops already though I still feel I am doing something wrong. Luckily, it's just the "GEO" fund I was using to poke around. I think I'd better stop chasing momentum like a headless chicken now.
Most of the issues right now appear very heavy or this is just the much needed correction? I think I was right on the overly bullish move of DMC yesterday. The momentum of JGS also come to a stop. No stops are hit so no selling yet.
After the huge drop in RFM yesterday, it made a nice recovery today. 5% in a day is nice but looking from its transactions, it appears to have wide spreads so I think I'll pass for the mean time.
What pulled down the market btw?
Wednesday, May 11, 2011
Missed the DMC train today. Damn. My calculated entry for DMC is 46.07. It's either I buy tomorrow IF it corrects(hopefully I am right in reading the overly bullish movement today) or I buy with the new-high-setup.
Turns out I read JGS right. Either I buy at the open tomorrow or apply new-high-setup too.
Isn't RFM undervalued already? FY10 income report came out today, growing by 71.4% and the stock drops by 7.95%? I do not understand. Charts later if I don't get too wrapped up in playing Dragon Age 2.
Turns out I read JGS right. Either I buy at the open tomorrow or apply new-high-setup too.
Isn't RFM undervalued already? FY10 income report came out today, growing by 71.4% and the stock drops by 7.95%? I do not understand. Charts later if I don't get too wrapped up in playing Dragon Age 2.
Tuesday, May 10, 2011
Monday, May 9, 2011
52-week new high on Friday rule
“The 52-week new highs on Friday rule” is usually applied to the market itself and not to an individual stock.
Rule number 1: On a new 52-week high, when the market closes at or close to its high on a Friday, buy long and go home long for the weekend.
Rule number 2: Exit the long position on the opening the following Tuesday.
Rule number 3: If the market opens lower on Monday, exit the position immediately.
Originally shared by Shoyu Ramen in Finance Manila. Hope he doesn't mind me posting this one out here(sharing to other people and for personal use). Will take this one down if he doesn't want other people posting his stuff.
*Originally from Ino.com. Click the title for the original video/lesson.

Gold ($GOLD - Continuous Contract (EOD)) Index
50-EMA trade setup on gold:

Bounce from RSI-50 is a bonus. Stop-loss depends on one's risk appetite.
Take profits when you're happy.

Bounce from RSI-50 is a bonus. Stop-loss depends on one's risk appetite.
Take profits when you're happy.
Damn missed the boat in SMC. I was expecting it to consolidate further, around 2 to 3 days, before recovering. It caught me off guard!!!
I finally got a buy signal from JGS I am comfortable with so I put up a relevant position in it. Added some more LC. BDO seems recovering already.
My LC in the PSE-STG is already up by 46.55%! Lol. If I only had the balls when it first made its "new high" then. Oh well.
GEO had a private placement today (950M shares) at par. I hope it doesn't gap tomorrow. I'll be putting my "barya" there tomorrow.
Market, please be good so I can buy my own place. <3
Friday, May 6, 2011
CEBU AIR, INC. (CEB)
Daily line chart:

Buy on pullback after breakout setup?
Resistance/Support @90 +3% bounce filter = buy stop @92.7
Not a recommendation to buy. Just thinking out loud.

Buy on pullback after breakout setup?
Resistance/Support @90 +3% bounce filter = buy stop @92.7
Not a recommendation to buy. Just thinking out loud.
Thursday, May 5, 2011
GLOBAL-ESTATE RESORTS, INC. (GERI)
Weekly line chart:

Potential double top as the trend has been pretty much extended already.

Potential double top as the trend has been pretty much extended already.
Gaps: Trading gaps.
FGEN: Gap acting as support. Gap is not filled.

PNX: Fade the gap. Gap filled.

MPI: Filling the gap.

SMC: Gap down. Fade the gap(?)

This post only shows how gaps act. Some doesn't get filled and act as support(FGEN). Some are filled a few weeks after building a base(PNX) while some gaps don't get filled outright. Sometimes, it takes a gap a really long time to get filled(MPI).
That being said, no one can really say how the gap in SMC would act. One thing is certain though, act when the opportunity says so. Not because a blogger says so or forum members say so but when your trading system says so.
Theory says that all gaps are filled, sooner or later. They say it's nature's way of things. :))
Once the gap is filled, price action resumes the direction of the gap.
*So if FGEN trades beyond 21 and the entire market crashes back, look to buy at 10.40-10.70 :)) (Just kidding).
SMC SMC SMC
SMC closed at 153 before when it was range trading around 150-180 range when I decided to test my system if it could be used for price prediction. This is done on the PSE trading game so there's no real money involved. Okay, now that being said, I put up a buy stop at 150 which got hit last 4/12/11 before closing at 153 that day. I think it was Livermore who said that if the price goes your way right after you put up a position, it means that you are on the right side of the market - which I believe.
Then, the company decided do a voluntary suspension on the issue the next day "to avoid manipulation". Clearly, that's a very noble intent as they were trying to protect their investors. Or so they said. A few days before the voluntary suspension was lifted, they finally announced that they are going to sell their secondary offering at the lower end at 110. That being said, it feels like they did exactly the opposite of what they said. They wanted to avoid other people manipulating their stock because they wanted to do it themselves. Lol.
Anyway, enough of my personal opinion. Let's look at the chart instead:

Before the suspension, range trade 150-170(180) with stop loss right below 150(5-10%) depending on one's risk appetite.
Going -30% after the suspension was lifted, what would be the right thing to do. Would you still hold? I don't know. This is the first huge-gap-down-case in my trading career. Daig pa ang basura stocks.
I think, the best way to deal with this(for people without position in SMC) is to fade the gap. After the dust settles and the price stabilizes, I would wait for a buy signal before putting up a position and sell a little lower than 150 so I wouldn't be with the people who still have 150+ wanting to get out. Pwede din kahit 10% lang masaya na ako :D
Tuesday, May 3, 2011
LEISURE & RESORTS WORLD CORP. (LR)

Two days with huge volume during a consolidation period. First day(4/19/11) are pretty much scattered buyers and sellers while the second day(4/28/11) came from the huge cross from 263(Venture Sec).
Huge volume in a consolidation period. Whatever that means, I do not know but I'm watching. No signals from my system yet.
**Too lazy to do the review on the ICT trade. Too busy watching Game of thrones!
Thursday, April 28, 2011
Before and After!
Ha! New post! It's not issue/stock-tip related though. It's about my progression as a trader for the past year and a half.
Here's how my chart looked like when I started to study and practice technical analysis:

Don't forget that I also used candlestick analysis + RSI readings!
Now, here's how my chart looks like:

The candlestick settings are still there but just for aesthetic purposes only. No more trendlines or other technical indicators. You might ask how could you trade with technical analysis without using technical indicators. Well, what I am using now is simply a variation of TA, coupled with more solid trading rules in comparison to what I was doing before with all those technical indicators. Plus I wanted to keep everything as simple as possible. Hopefully, I would be able to trade without using charts anymore. You can call this progress right?
With that being said, I don't think I would be making/posting any technical analysis soon. Anyway, if you are practicing TA and still soliciting "guru" advices, I think you need to re-evaluate what you are doing.
I'll post a review on my trade on ICT using my current rules of trading vs candlestick, RSI and whatnots when I wake up tomorrow.
Happy trading!
Monday, April 4, 2011
Friday, April 1, 2011
Thursday, March 31, 2011
Here's my portfolio in the PSE-AT Trading Game:

Majority of my position in AP are at 29.85 so I tried to squeeze in more shares as much as possible. Today's action was the confirmation for the buy signal I was having the past 2 days.
AT had a DMI buy signal today so I used the proceeds from DMC and MEG. Sold both for small losses.
I also added CMT today from the remaining cash from DMC and MEG.
The other stocks are the ones I bought before(2nd-3rd week of March).
Nakaka-2% na ako!
Trading Frequency- 35!
Wednesday, March 30, 2011
Let's hope that today's gain is not superficial as majority of the gains for today came from TEL and GLO.
Somebody has already made 300% on the PSE game early this morning but his/her "paper profit" is not cut back to 200%. What could you possibly holding to gain 200-300% in a little less than a month? If you can do that in a relatively average month, imagine what you can do on a fully developed bull run! 1000% in less than a month?! Ignore than, anybody can make money in bull runs.
Just imagine if you can consistently gain 200-300% a month, you wouldn't be joining a 70k tournament.
This is what I have in my port in the tournament bought on the 2nd week of March:
Too bad I got lazy to log in to sell ICT and buy more JGS before. Port is up by around 1%!
Somebody has already made 300% on the PSE game early this morning but his/her "paper profit" is not cut back to 200%. What could you possibly holding to gain 200-300% in a little less than a month? If you can do that in a relatively average month, imagine what you can do on a fully developed bull run! 1000% in less than a month?! Ignore than, anybody can make money in bull runs.
Just imagine if you can consistently gain 200-300% a month, you wouldn't be joining a 70k tournament.
This is what I have in my port in the tournament bought on the 2nd week of March:
AP
29.85
28.95
50,000
1,447,500.00
-45,000.00
BDO
48.90
50.80
35,000
1,778,000.00
66,500.00
DMC
38.85
37.85
44,000
1,665,400.00
-44,000.00
ICT
42.00
41.50
23,800
987,700.00
-11,900.00
JGS
18.98
25.30
10,000
253,000.00
63,200.00
MA
0.031
0.031
4,900,000
151,900.00
0.00
MEG
2.17
2.06
70,000
144,200.00
-7,700.00
MER
226.80
251.40
8,000
2,011,200.00
196,800.00
PX
14.16
14.84
100,000
1,484,000.00
68,000.00
Too bad I got lazy to log in to sell ICT and buy more JGS before. Port is up by around 1%!
Monday, March 21, 2011
Hey folks, I am still not trading lately although I am still monitoring the market. I still believe I am not fit to trade as of the moment. Anyway, please do visit dimsumtrader.wordpress.com if you really want to learn more about how to trade etc as she shares alot of informational stuff. It's not a place to go if you're simply looking for a "hot tip" though.
Monday, March 14, 2011
Monday, March 7, 2011
I happen to stumble upon the Facebook account of Absolute Trader's Absolute Online stock market challenge and my God, people need to chill the F out. It's just a game. I joined the game and I have only got to start playing the game last Thursday when the market was up by more than 1%. What was I suppose to buy that day? Haha. Anyway, I am just still applying trading ideas(new and old) so I don't really mind whether get included in the rankings. Anyway, there's a loophole in the tournament rules naman so expect it to get abused :))
Also, it's a bonus if I get to win the tournament right? Haha! You are sure to lose the game if you're a trend rider though.
Also, it's a bonus if I get to win the tournament right? Haha! You are sure to lose the game if you're a trend rider though.
Friday, March 4, 2011
Wednesday, March 2, 2011
Scatter shot!
The index today closed somehow flat, losing a mere 10 points in comparison to other Asian markets losing more than 2%. Value turnover is average with another 200M worth of foreign selling.
The superstar of yesterday, AEV, continued to be the main drag of the index, losing another 3.22%. Joining the fray are PNB -3.26%, RFM -3.03%, and SECB -2.94%. Other losers with heavy volume are LND and CYBR losing 4.15% and 3.95% respectively.
Setting the balance off the losers are TEL +1.59%, MA and MAB with 9.38% and 6.06% respectively, Lopez stocks coming back to life led by LPZ +5.51% and FPH +4.59, MWC +4.07% after getting sold down the other day, followed by SMDC +3.26% and SMPH 2.94%.
If anyone has noticed, gainers and losers are pretty much still scattered, which leads me to the conclusion that the market is experiencing rotational trading. I believe that being said, buying and holding, even trending stocks, is still not the way to go.
With that being said, I would be writing less for the moment and trade more. I would be using the 3 short-term trading methods that I have been testing and refining for the past few months plus the doji setup.
Oil is back again to the 100 levels, a flag/pennant is forming on the daily chart suggesting a huge upswing in the short term. Gold has also broke slightly higher than its previous high at 1430 at 1431.
I have been not posting charts lately as I am starting to remove charting from my trading to some extent. I am still using the charts to remember the price movements as I have a terrible memory remembering actual figures. My trading decision is now mostly based on price movement.
It feels like trend following has dulled my senses. Or I am probably doing it wrong.
Good luck to all, specially to me! :))
Tuesday, March 1, 2011
The index closed lower from its high as profit taking in AEV pulled the index down. However, the spike in AEV caused most of the issues to rally today, negating the correction of AEV which left the market with 17 points.
Gainers for today is led by LND with massive volume, gaining 12.87% followed by PAX +11.32%, CEB +10.13%, ORE +8.61%, VLL +8.26%, ICT +6.73%, JFC +5.51%, PX +4.08% and MEG +3.88%.
Losers for today is led by AEV -7.45%, MA -5.88%, MAB -2.94% and NIKL -2.40%.
Best case scenario for AEV is to form a flag/pennant pattern.
The guy from ASIASEC, buying up at the close from last week, decided to sell at the close at 20.35. Buying up the stock to 20.90/20.80 and then selling at 20.35? This doesn't makes sense to me.
Going to trade actively now. Just waiting again for trading setups to appear. Hopefully, the market reaches 3900 levels before heading back down to confirm the sideways bias.
Monday, February 28, 2011
Speculating
People had been speculating that the sell down in several issues is due to the fact that they are shifting funds to AEV. Do you think that the big players are impulsive traders? Sounds pretty ridiculous.
Aboitiz!
The index has held above 3730 support and suggesting further advance/s in the short term. If the index meets resistance at 3900 levels, I would be expecting it to move sideways from that onwards, until it breaks a support/resistance.
Today's performance was led by AEV with a humongous gain of 17% for today, lifting
the index up by 29 points from -26 points with exceptionally high volume courtesy of AEV 3.8B turnover, followed by AP, AGI, MBT, TEL and SM.
Gainers is led by AEV +17.50%, followed by ORE +8.54%, PCOR +7.69%, GLO +7.58%,
SECB +6.44%, CEB +5.95%, CYBR 3.88% and AP +3.24%.
Losers is led by PX -9.84% after releasing the news of 100% increase in income for the 2010, ICT -8.08%, MWC -5.63%, JFC -5.49%, WEB -4.62% and VLL -4.11%.
TEL did completely the opposite of what I was expecting, losing 2.79% instead.
Totally missed out the action today in AEV. I was thinking whether to buy the 7k shares at 43 or not but I decided not to act on it. I would be very cautious to buy AEV now. A very long white candle with large volume could probably result into a blowout. MACD/RSI bearish divergences are both showing on the daily chart. Weekly chart is showing bearish RSI divergence too. With that being said, it is probably safer to trade it with a tight stop loss.
The volume in AEV today could mean a blowout or it could also mean a reversal already. Place your bets.
NIKL is still being bought up at the closing. A strong close at 22 or above would suggest that the demand for the issue is back.
Previous doji setups in CYBR is now up by 3.88%, MBT slightly higher, MPI slightly down, NIKL up by 3%, and SECB is now up by 5%. Removing the lagging MBT and MPI, issues with a doji setup produced profits after an average of 2 days, gaining an average of 3% during the holding period. 60% of winning rate with 3% average gain in 2 days after the doji setup, 40% chance of losing with minimal loss(commission and tax) within the same holding period. Profitable? Maybe the other positions would also turn out profitable after a few more days or so. Will monitor further to determine how long it would take to make them a winner/loser.
Friday, February 25, 2011
Recovering slightly.
I was out the entire day so I didn't get to monitor the market today.
The market barely moved today, gaining only 6 points against other Asian markets with an average of 1.10% gain, on a relatively higher value turnover.
Looking at the weekly chart of the index, I believe we just found support at the current levels. If, however, we drop below at the current levels, I would not be surprised to see the market to lose another 10% or so in the short term at the very least(3360 levels).
Gainers are pretty much scattered today from third liners to blue chips, led by MER +7.50%, ELI +5.56%, LND +4.97%, EEI +3.98%, NIKL +3.47, MWIDE -continued to buck the general market trend- +3.14%, PX +2.97% and RFM +2.50%.
Losers are led by the week's gainers MA -5.71%, MAB -2.86% and LC -3.33%. Majority of the losers are third liners with CMT -5.97%, VLL -3.23%, and SMPH -2.86% coming from the second and first liners.
I totally missed TEL's RSI reading yesterday as I am using a very short term settings for it. It's daily RSI reading dropped to 7.16, reaching its lowest reading in 11 years! If you are after it's dividend, it was at its safest(and cheapest too) level yesterday! My gulay. Weekly RSI reading suggest that it could still go head down a little further as its weekly lowest RSI reading is at 20.25, a mere 10 RSI points difference. But with the daily candlestick pattern is suggesting a sharp reversal already. I am just making a wild guess but I think it could gain around 10% by next week. This is a very wild prediction ha!
My hypothetical short coverings on AP and MER produced pretty good returns had I actually reversed position and went long in actual trading. That means my trading ideas do work!
NIKL finally recovered after the sell down during the week. Nickel price has decline in the world market and I am assuming that it could move sideways for the meantime. With that in mind, I would probably range trade for the mean time as I am now trying to avoid being stuck as much as possible.
Revisiting the doji setups, CYBR is now breakeven from entry point with 1.12 as a target, MBT is slightly down, MPI is unchanged but a strong close above 3.55 would suggest a further short term upswing, NIKL now up by 3% from entry while SECB is still down from entry point after opening higher right at the gap down resistance.
If you are observant enough you will see that the issues that closed higher than yesterday have a similar characteristic while the losing positions also have the common characteristic. So therefore, trading dojis with the characteristic of the winners will be traded and the losers will be scratched off the board.
Western markets are up by more than 1% tonight. Gold is still trading above 1400(1405) while Oil(WTI) has dropped below 100 again.
Thursday, February 24, 2011
What do you make out of this?
Chart 1

Chart 2

Chart 3

Chart 4

What the title says, what do you make out of this charts? Up? Down? Sideways? Reversal?
I removed the price and name of the chart to lessen the bias in analyzing the issues.
Black candles indicate advances and white candles indicated declines.
Feed backs are more than welcome. Thanks in advance!

Chart 2
Chart 3

Chart 4

What the title says, what do you make out of this charts? Up? Down? Sideways? Reversal?
I removed the price and name of the chart to lessen the bias in analyzing the issues.
Black candles indicate advances and white candles indicated declines.
Feed backs are more than welcome. Thanks in advance!
Nothing catchy
The market lost another 26 points today after recovering strongly yesterday, losing a total of 52 points in the past two days after the turmoil in Libya erupted. Value turnover has also dropped below the average of this week so there's probably no more sellers now as the index is now resting at the previous low. The market didn't get into the green today as I was expecting but the decline is within expected range.
Gainers for today is led by MA +9.38% after the rumors of the done-deal with MVP, followed by OPM and OV with +7.69% and 7.14% gains respectively due to the price surge of crude oil -breaking past 100 last night; and AEV gaining 3.71% for today and I have no idea why.
Losers are mostly composed of third liners again, with GLO being the heaviest of them all, losing 4.45% and the continuous selling in TEL caused it to decline further by 1.79%. I really believed that TEL was holding up at the 2300 levels the other day!
CYBR is now at its major support with doji losing 2%, MBT succumbed to profit taking after gaining around +2% during the day, MPI hardly changed, NIKL was bought up again at the closing(I wonder how long could ASIASEC keep this up) while SECB declined further by 1%.
1 unchanged, 1 winner and 2 loser with a net of 0.52% loss, not counting the unchanged. I think that the pattern has a low winning probability on the next day.
Let's see how will the patterns work out to the positive territory next week.
Crude oil(WTIC) broke past 100 last night and now trading at 98.90 while Gold is now above 1400 levels, trading at 1411.
Wednesday, February 23, 2011
And more panic.
We probably saw panic in its truest form today as the market opened lower(gap down) dropping to a whopping 70 points on the earlier part of the session before recovering 43 points on the later part, closing lower by 27 points only from yesterday. The Index held above the previous low at 3738. Taking the account of today's candlestick at the support, we might see the green side of the pasture tomorrow.
I was already panicking when I saw NIKL sold down immediately to 19.82 level. I wanted to close the position already! But then I was telling myself that if I sell it at that level(19.82) I would be selling it at a major support and that is not the right way to do it.
I really like seeing doji stars and small black candles at the bottom of a downtrend as they provide less riskier entries for short term trades and they usually provide at least a 5% gain for the trade.
CYBR, MBT, MPI, NIKL, and SECB forming possible bullish reversal patterns(short term) if they move up tomorrow. Hoping for a recovery tomorrow as majority of the issues are pretty much oversold already.
As I've written before, I am in the quest of catching the bigger fish. It seems like the big fish is trying to bite my arm off.
I am still hoping that majority has sold(cut their losses) their positions already.
ASIASEC is RSA/GSIS/SSS/Govt institutions broker pala.