Monday, May 30, 2011
Saturday, May 28, 2011
CEB
My initial reading suggests a pullback to around 90(weekly basis) after breaking out to warrant a buy although I wasn't expecting it to drop up up to the current level.
But it did:

It retraced to 61.8% Fib levels. Nonetheless, it provides a relatively good short term upside at current levels up to the recent high of 98.
All we need now is positive(weekly/daily) momentum.
Confirmation of move this week:

Even if this is just an A-B-C correction(in a downtrend), you'd still have one profitable leg/trade.
Friday, May 27, 2011

Universal Robina Corp (URC)
One crazy idea:

It was suggested that the wave 3 is the longest wave. If I recall it correctly, wave 3 is like x2-x3 of wave 1.
Please take note that I do not practice Elliot wave theory, thus this is just one crazy idea that I have.

It was suggested that the wave 3 is the longest wave. If I recall it correctly, wave 3 is like x2-x3 of wave 1.
Please take note that I do not practice Elliot wave theory, thus this is just one crazy idea that I have.
Trader's Toolbox: Reversals
Rules to mark a reversal high:
1. The market must make a new high for the last six to eight weeks.
2. The market must close lower than the previous day’s (or week’s) close.
3. The market must reverse the previous day’s (or week’s) action.
From CLUB.INO.COM. Original post linked on the title.
1. The market must make a new high for the last six to eight weeks.
2. The market must close lower than the previous day’s (or week’s) close.
3. The market must reverse the previous day’s (or week’s) action.
-To clarify rule three, the day or week preceding the reversal must have posted a positive close.
4. The market must post follow through action the next day (or week).
-To clarify, the market must close lower on the day (or week) following the reversal.
5. Fifth, the reversal must be accompanied by moderate to high volume. And, finally, the reversal must occur in a terminal (critical) area.
5. Fifth, the reversal must be accompanied by moderate to high volume. And, finally, the reversal must occur in a terminal (critical) area.
From CLUB.INO.COM. Original post linked on the title.
Philex Mining (PX)
Broke into a new 52-week high (on a Friday).

My initial entry is @19.22(1) but I decided to sell 60% of the position(2) that resulted -0.06% of capital as the price of LC that day looked pretty attractive.


My calculated breakout buying price is @20.03.
However, RSI is relatively weaker vs price with bearish RSI divergence which are bugging me so I am keeping a tight trailing stop for the meantime. Long white candlestick accompanied by huge volume suggests a short term overly bullish sentiment.

My initial entry is @19.22(1) but I decided to sell 60% of the position(2) that resulted -0.06% of capital as the price of LC that day looked pretty attractive.
Position is now up by 4.65% from adjusted entry price.
Looking closer at the 5-minute chart:

MACD bullish divergence was seen on the 5-minute chart but the price reversed only after RSI divergence.
Crazy juice flowing on the weekly charts:

Pullback after breakout(red circle) from symmetrical triangle pattern with (+/-) 22 as target.
RSI historical resistance 86.
It took 14 weeks to resume its uptrend after breaking out which is kinda hard to time. lol.
Maybe I can (much later on)when I get better in trading.
Thursday, May 26, 2011
Wednesday, May 25, 2011
Sold(cut-loss) half PX @19.66 earlier today. Remaining position break-even level is now up @20.
Proceeds used to buy additional LC @0.81.
Free cash used to buy additional LC @0.78.
Only 1 losing position in LC, bought @0.85.
I'd probably lighten up somewhere 0.90+ but if this one closes higher than 0.88, I'd probaby hold for the meantime.
AGI broke down/gap down and closed below support @11.
DMI sell signal on daily and weekly chart.
wRSI broke down.
Triple EMA breakdown.
Pattern breakdown target: 9.12.
Medium term support: 10.
AP weekly 50MA/Pattern support: 27.
wRSI broke support.
AT Range trade. Trading range 16-18. Possible trend candidate. wMACD Buy signal.
CMT support 1.20.
LCB possible doji setup.
LR possible doji setup.
MA gap support @0.039 held(?)
MER MPP possible penetration. Buy stop @257.
PX weekly reversal pattern. wRSI sell signal. Watch price movement at wRSI support.
SMDC range trade. Trading range 8.50-9.50.
SMPH breakout candidate. Normal resistance @12. Trading range 11.50-12.
URC WPP buy signal.
PSEi is bearish. New RSI low but index is still not making new lows.
All shares index looks like holding up(RSI support).
Financial sector is forming successive lower RSI highs(bearish divergence). DMI sell signal today.
Holding sector is forming successive lower RSI highs(bearish divergence) and currently trending down but trend strength is starting to pick up.
Industrial sector is holding up(RSI support) but currently trending down and trend strength is starting to pick up.
Mining sector is holding up(RSI support) with a possible short term reversal play(doji setup).
Property sector appears to be in a weak downtrend.
Service sector appears to be in a weak downtrend.

Tuesday, May 24, 2011
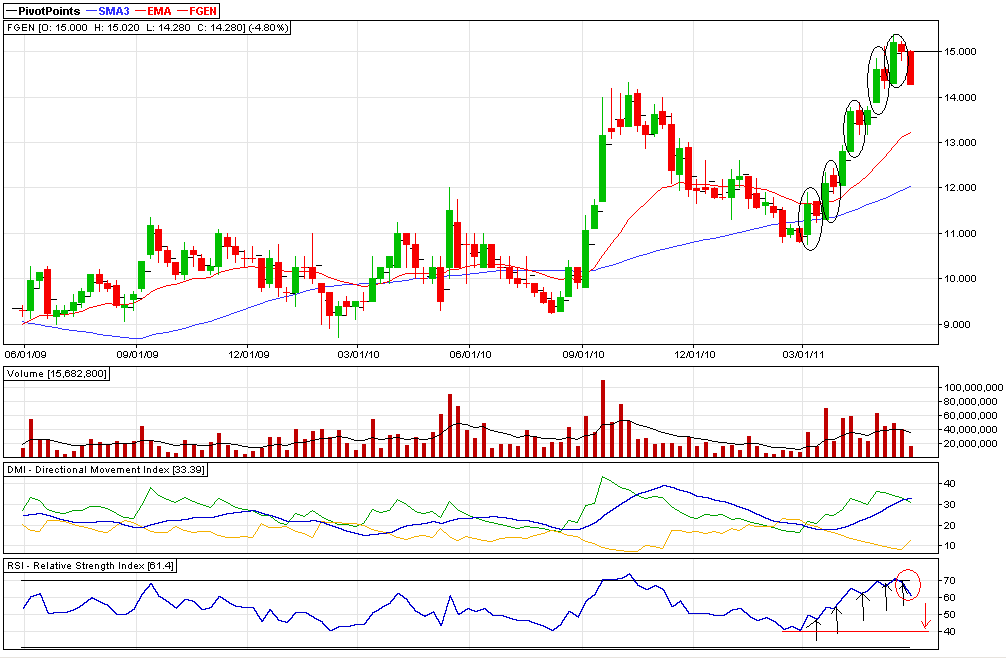
FGEN
Good thing I checked FGEN's weekly chart despite the urge to buy after the four consistent pattern it was showing:
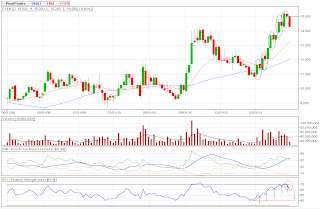
I think it's better to wait for weekly RSI 40 for the mean time.
I think it's better to wait for weekly RSI 40 for the mean time.
I wasn't expecting the gap down today though.
Got stopped out in FLI @1.21.
I really thought that the 10-min downtrend in LC is about to end when it went the other way around today so I decided to place a barat bid @0.78 which didn't get hit today.
121 bought up alot of shares yesterday @0.85. 121 sold alot of share today @0.83.
I'd probably add some in PX tomorrow if it starts recovering by then.
Finally some volatility in AGI! I am really tempted to buy some earlier but I didn't. I would be waiting for a confirmation tomorrow but if AGI drops to 10.50 levels, I think I would jump on it. Bullish divergence on the 10-min chart suggests a short term bottom is just around the corner.
Or place a buy stop in BEL? Range looks pretty good and can be traded.
Monday, May 23, 2011
Today was rather boring although I think today would have provided some good entries to certain issues.
Issues that I am looking at this week are AT/BEL - range trading, PX/LC/B/URC - trending with LC/B/URC completing a 1-2-3 pullback setup and finally CEB for a pullback after a breakout setup.
I think LC needs to close higher than 0.88 to continue heading up.
Hopefully, CEB closes somewhere @90 this week to confirm my theory.
I am confused with URC's price movement. I am wondering if today's price action completed it's 1-2-3 pullback today. Lemme see my notes...
No idea what happened to MEG today.
I love small red candles. <3
Sunday, May 22, 2011
Manila Mining (MA)
Sometimes, I don't know if I am just having a bad break or simply being stupid when trading.
Here's one of the reasons why I stopped trading with candlesticks(well I still do trade with doji candles though):

A hammer followed by a bullish engulfing = $$ right? Not this time. Had you traded it that way, you are down by 6% or so in the trade already plus another 6% or so, depending on your position size while waiting for your stop to be hit.
Or maybe, I am doing it all wrong. Perhaps wait for the gap to be filled/position at the gap instead?
I'll toss a coin if I would place a barat bid at 0.036.