Capitulation? Long black candle with spike in volume suggests panic selling. DMI(ADX) value has also reached the highest in the last six months. RSI value has also reached its lowest in the last six months.

However, despite of observations, I believe that it would be better to watch price action to stabilize first before taking any actions such as bullish divergence on daily and weekly charts and/or sideways breakout.
Weekly Chart:
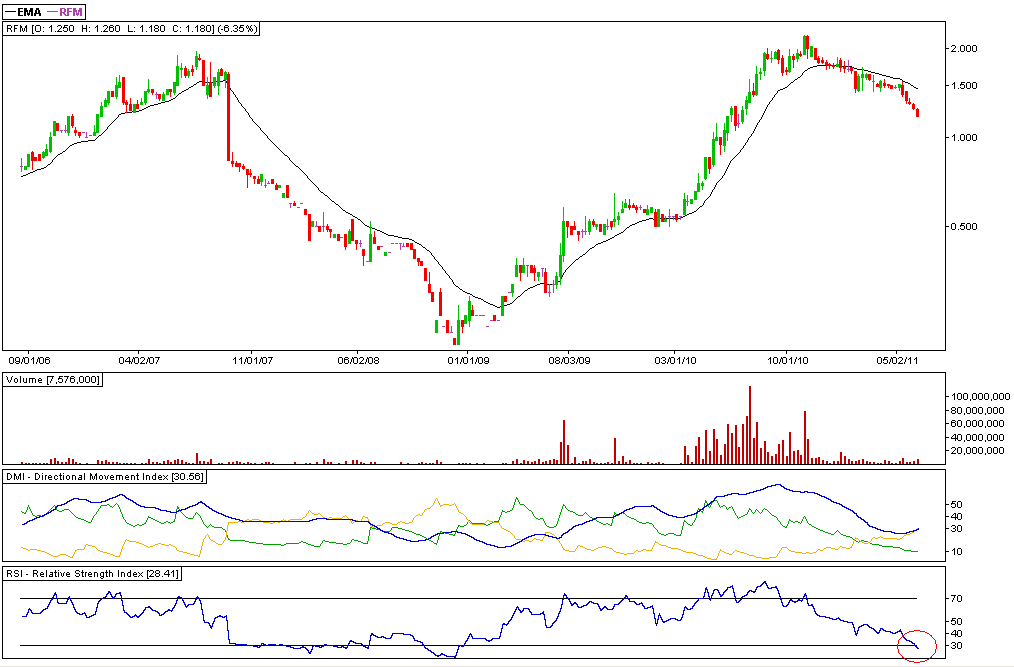
RSI has dropped below 30 on the weekly chart suggesting a parabolic drop is probably in the works.
Trading plan: Watch the circus. Sell rallies to 20EMA.
No comments:
Post a Comment