Friday, February 11, 2011

Culling the weak.

Jesus Christ, wave after wave came the selling as the market opened, sending the index to a low of negative 60 points. From that point, I know that the market has entered a short term parabolic drop. Margin calls have been very evident during the opening as most of the selling was coming from COL. Value turnover for today has dropped significantly (but almost the same levels from the past 2 days if you discount the huge cross sales in AEV) which is fairly acceptable for first green day after a huge decline.

The margin calls seemed to be abused by brokerage houses as they only need to push the prices just a little more after the huge drop from yesterday. I think the right term for it is "squeezing out of the trade". Like when somebody pushes up the price just a little higher than usual when there is alot of short bears. Bears take cover, pushing the prices higher. Then the one who pushed the price unloads his shares to the covering bears.

This is just a fruit of my wild imagination though. :P

This is what happened in AGI during the first 30 minutes of trading:


I knew it was bound for a bounce so I wrote the text on the chart. I was deciding to close my entire position in AGI that time. I did not close it but sold the shares I got at 12.18 the day before at 11.28, right at the last doji after the steep decline. I needed the cash to increase position in NIKL. Right after I sold the shares, bam, somebody bought it up to 11.40. I was like, what the f? Anyway, I still have my original shares at 11.74 so the closing today is not bad.

Closig bid/ask looks pretty good to so I expect it to resume heading up by next week. Hopefully it breaks out of its pattern successfully next week.

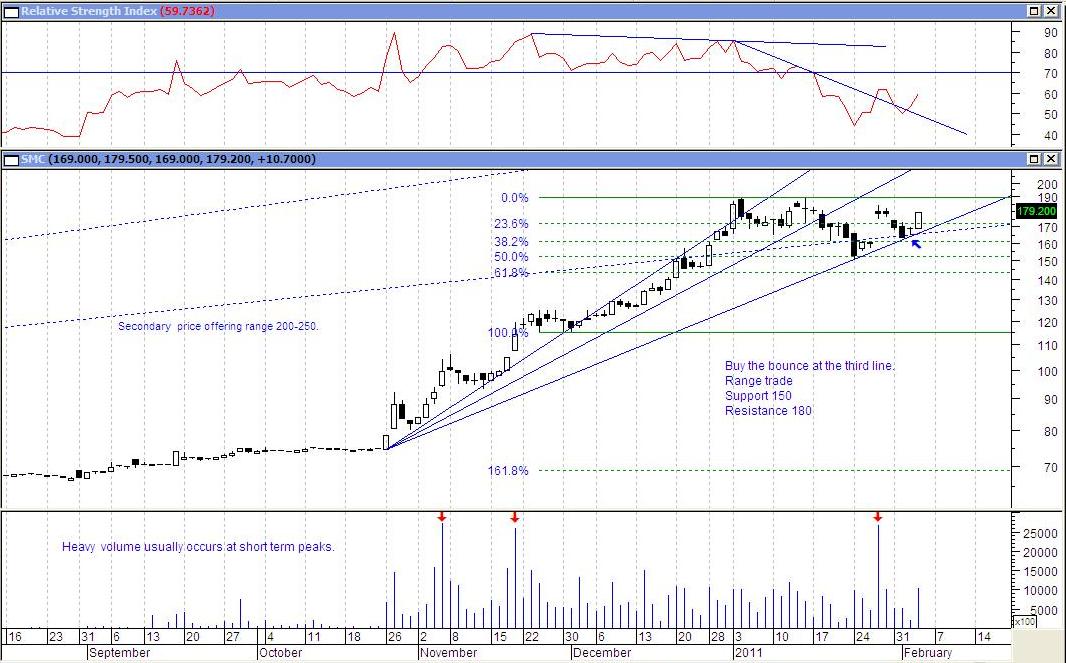
I closed my position in SMC today despite of the bullish pattern that I was seeing in the 5-minute chart - ascending triangle. However, the target was only pointing at 185 - my original entry. So I closed the position.

With the cash I was able to generate from AGI and SMC, I increased my position in NIKL. I have increased my position in NIKL by 240% so I am pretty heavy in NIKL now.

INTRA INVEST has only sold 380k shares today. A little more than 4M shares to go.

Hopefully, everything recovers by next week so there would be a chance for us to unload/limit the losses. A dead cat bounce so to speak.

Thursday, February 10, 2011

Foreign Activity

Net Foreign Selling has already amounted to 7.3B YTD.

How much more do you guys still have to sell?

Philippine Stock Exchange Index (PCOMP)


RSI just went into oversold territory. The only problem now is how long will it stay oversold and how deep do we go before we have that dead cat bounce.

Nickel Asia Corporation (NIKL)


Following the trend.

London Metal Exchange: Nickel


CASH BUYER 28,255.00
CASH SELLER & SETTLEMENT 28,260.00

Semirara Mining Corporation (SCC)


Following the trend.

Manila Electric Company (MER)


Trending down in an accelerated manner. Bearish flag breakdown at 224.
Hypothetically short at 119. Looking to cover(initial) at 200.
If it breaks below 200, best level to cover is at 156.

Alliance Global Corp (AGI)


Fake out at the breakout?

Ohh shhi- - -

Yes, I was like that during the entire session today. Wave after wave of selling didn't falter even until the closing. Only selected issues were able to recover by the closing.

The market broke the "support" at 3800 today on heavy volume, shedding 105 points today or 2.73%, closing at 3738. Even without the huge cross in AEV worth 1.7B, the total turnover for today still falls around 4.6B which is pretty bad specially on down days. Jesus Christ, 100 points in a day. Looking from here, filling the gap at 3600 looks pretty plausible in short/medium term.

The low value turnover earlier this week meant the lack of buyers. So there, we got the confirmation today.

I believe that with the sharp drop of the market today, we are probably bound for a quick dead cat before heading down further. Worst case thing that could happen would be another wave of panic selling without the dead cat.

The only issue that have a significant gain and volume is MRC but one can only look at it with skepticism as it is pretty much a controlled issue. Looking at its intraday trades, it only moved at the closing. It feels like it was manipulated today so it would have some "momentum" for tomorrow, hopefully enough to disposed whatever was bought today.

My positions in AGI and SMC went underwater today. Panic selling was also seen on both issues, with SMC going even beyond the 1% risk intraday. I was telling myself the entire time to endure the drawdown, endure the drawdown. What was bought on the closing should be held and sold at the closing, not during the panic selling. I think that worked pretty well as SMC recovered at the closing, hanging by a thread.

I was looking at the weekly chart of AGI and it occurred to me that the consolidation could probably extend up until the end of February. I'll decided on what to do with AGI this weekend.

SMC touched the bottom of its triangle support and it was trying to hold at that level during the entire session. Luckily, the stock recovered at the closing, safely holding up above support line.

I was actually surprised with NIKL's performance today. I was expecting the drop as it usually sheds around 6% whenever it makes a correction. But after two consecutive days of correction, it has only lost 3.75% so that would leave another 1.25% or so drop in the short term if we follow the pattern of its correction. I added another batch today at the closing. If it does drops another 1% or so, I would definitely add some more.

*I was digging up previous transactions in NIKL because I have observed INTRA-INVEST has been selling 9 days straight for the whole month of February. So I went to digging and I found out that they have around 7M+ shares from 16.50 and they have only just sold 3M shares. So if they don't buy any more shares, it will take them the whole month of February to close their entire position.

So if I have more than 100M invested, it will take me at least a month to liquidate the entire position. That's pretty interesting.
Wow, who let the dogs out? -80 points already.

Panic selling.

Wednesday, February 9, 2011

Nothing catchy for today.

The drop today looks pretty bad as value turnover has once again increased to 5.9B, 1.68B came from the huge cross in AEV at the open at 33.60. Discounting the huge cross, the value turnover still falls to more than 4B.

Gainers with significant volume are ELI +5.80%, LC +2.35%, RLT +2.94%, LND +1.94% and AGI +1.67%.

On the other hand, losers with significant volume is led by ION -9.59% which was the superstar the other day, MRC -5%, CMT -3.80%, RFM -3.64%, DFNN -3.26%.

Index heavyweights for today are ALI -3.45%, MA -3.33%, and MBT -3.25% with TEL also losing 0.58% after waves of selling orders.

NIKL has started its correction in the short term. I still have some cash left so I would probably put up another position here after the correction.

AGI has somehow broke out of its triangle pattern - specially from its 5-min frame) at 12.10). If AGI closes at 12.36 or higher, I am fully convinced that it has broken out of its trading range already. I really hate seeing small white candlesticks during uptrends.

I am somewhat disappointed in SMC though as it closed flat from yesterday. Still hesitating at 185 levels! I am expecting it to head back to 180 if it encounters a corrective-consolidation cycle. Breaking down below 180 after the cycle is bad.

If SMC would still remain a laggard after AGI breaking 12.36 and NIKL starts to resume its uptrend again, I would probably liquidate it to add on both positions.

AEV had a humongous cross at the opening. 50M shares at 33.60. I have learned before that volume spikes usually starts something, a turning point so to speak. Putting some special attention to it from now on.

Position in SCC(my aunt's) still looking good. Definitely trending so I'm just gonna follow it the trend.

I would try to post something about foreign activities later once the QDR comes out.

Psychology during Stock Market Cycles


So where are we? As for me, I am just feeling either excited or thrilled as of the moment. That's one step away before the end! XD

Anyway, I had a long talk with my aunt yesterday since I am the one managing her trading account. Despite of the relative bullishness of the market in the last two years, she still feels beaten up and skeptic with the market because of her massive loss in AJO(now MARC) from 2007 levels I think. I think I was able to persuade her to close the loser so we can use the proceeds to (try to) gain back what she lost.

Tuesday, February 8, 2011

Reversal Candidates


JGS gave a trending buy signal for today.
MPI about to give a trending buy signal. Signal is confirmed only on actual crossover.

*Did not put up a position in JGS. Waiting for a higher trough to form before getting in.
*Will not put up a position in MPI. Potential short/long term upside is the lowest among the selection.

Not a recommendation to buy.

Belle Corporation (BEL)

BEL Daily Chart


5-5.50 range good enough if you caught falling knives at 5.
10% possible upside for the dead cat bounce.

Enter short position after testing 5.50.

London Metal Exchange: Nickel

Nickel Prices Update:


CASH BUYER 28,700.00
CASH SELLER & SETTLEMENT 28,705.00

Since when I started to post the graph of nickel, nickel prices in the world market has gone up by 6.29% from 27000 last February 1

Link of the initial post: http://the-morningstar-option.blogspot.com/2011/02/nickel-price-graph.html

The target of the inverted head and shoulder pattern on the chart at 28500 has already been surpassed it coincidentally falls within the size of the possible upswing from the start of the move up to the break out point.

With this being said, Nickel prices in the world market could probably start correcting.

However, basing from the previous pattern, the upswing after the breakout has exceeded the inverted head and shoulder pattern by 25% more.

With that in mind, nickel prices still have a possible upside of 6300 per tonne.

Just my wild imagination!

*Ninja Edit:

Nickel is currently trading at $13/lb, higher by 6.12% since February 1 at $12.25/lb.

Nickel has risen by 13.92% from its 2010 price level.

Crazy forecast for nickel is it could reach a high of $16/lb.

Catching the big fish.

The market hardly moved today, closing lower by 1.55% on a slightly higher turnover value. Looking at the candlestick pattern of the index, a strong upswing will turn the market around for the short term.

Gainers with significant volume today are DFNN which continued to hold its gains from yesterday, gaining another 9.79% today. Other gainers with significant volume are LCB +3.49%, CMT +3.27%, NIKL +3.16% and SMC +2.95%.

Major index losers are SM -3.48% and AC -2.20%.

I totally missed the trade in DFNN since, well, I wasn't really observing non-marginable stocks for now. I am trying to look for/trade issues with consistent and sustainable trends.

AGI is looking good and it seems like it is poised to break 12 in the short term.
Symmetrical triangle pattern visible on the 5-minute chart was broken with breakout point at 11.80. Target is at 12.24. Closing is seems pretty strong too so breaking the barrier at 12 is very possible.

NIKL Continued to advance today, registering a new high at 23 before closing slightly lower at 22.85. 23 is jammed pretty good today but once it's taken out, it could still go higher in no time. The time that it would actually reverse and go south is when there is nobody is willing to buy higher. Until that day, enjoy the profits and follow the trend for a stress-free trading.

SMC seems to be poised to breakout at 185 so I opened up a position before the closing. I could probably made a mistake as the 5-min chart looks weak somehow.

I opened SMB intraday charts(5-min) by mistake but then I saw an ascending triangle pattern pointing at 35 as target.

The net has been cast so let's wait to catch some big fish.

Worth the time to watch this:

http://www.guerillastocktrading.com/lessons/im-a-jerk-which-stock-chart-is-better-part-2


It's like attending a seminar, for free!
(Copy-paste the url, blogger can't seem to put up a direct link to websites).

Intraday random rumbling

Betting a surge of buyers will be in line once 23 is taken out (NIKL).

AGI will breakout once 12 is taken out.

Meralco (MER)

Shorting 1000 shares at 218 if 220 is broken down.

Charts later.

Monday, February 7, 2011

Philippine Stock Exchange Index (PCOMP)

PSEi Daily Chart


What the pictures says.

Aboitiz Power Corp (AP)

Daily Chart


Hypothetically short of 4000 shares at 27.15.

Waiting for reversal and long entry signal.

Nickel Asia Corporation (NIKL)

Daily Chart


Following the trend.

Alliance Global Corp (AGI)

Daily chart


Poised to break out or went in too early?

Semirara Mining Corporation (SCC)

Daily chart


The issue appears to have plenty of bearish divergence which is used to determine a huge drop in the short term. However, the divergence appears too often in the said issue, rendering the signal hardly useful so I would simply follow its trend.

Yes please.

It was generally a boring market today as we had the usual morning sickness, desperately holding to a 13-point gain, sliding during mid session before closing 7 points higher at 3880. The way the market is acting up, I think we are pretty much poised for reversal. Declining volume plus declining NFS? Yes please.

As boring as it was, the general market decided to make some money in certain issues, ELI was able to sustain its gain until the closing. Looking closer though, it hardly moved during the day. It simply held onto its gains from the opening until the closing.
It gained 14.52% today with considerable volume.
(No matter how hard I look at its chart though, I can't seem to figure out to trade it).

Other stocks with considerable volume are DFNN 8.83%, ION 5.07%, and TA 4.76%.

I was convinced that AGI is on the brink of breaking out in the short term so I decided to put up the initial position at the closing.

NIKL performed pretty well today. The bearish RSI divergence got cancelled today. With that out of the way, I am going to follow its trend now. I am expecting profit taking by tomorrow. I would probably buy the final batch for the position once it makes a correction.

Just waiting for FLI to correct further before taking up positions. It goes back to its recent low, I would probably just sell the cats.

MPI gave a trend buy signal. However, price movement and volume is hardly convincing so I did not touch it. Yet.

Hypothetical short position in AP is down by 1.28%.

Sunday, February 6, 2011

Trading for a living

Here are some of the advices that I got from other traders I found over the internet from a different website - for free.

An excerpt from the conversation:

I think, as with any other job you have to take some serious training. Trading is a very demanding occupation I can think of quite a few jobs where your wages can vary from a low wage to a good wage in a day. But not many jobs when after working hard for 9hrs you are 2 grand worse off you will have to accept this some days.

So first you need to be financially stable it’s no good trading with next months mortgage. You need to train yourself by reading, watching the markets, talking to other traders, paper trading, etc, etc,

You need a proper strategy. Its not good enough to read the Sunday Times and trade all the tips you find.

You have to have the right Psychology the market eats gamblers for breakfast.
You need sound money management, is no good betting the farm on a tip you get off a web site.

You need to protect your capital using stops, spreading your risks, limiting your trading size Its no good making 6k one week to lose 8k the next.
Money is the traders most important tool without money you are not a trader.

But without training self-discipline or the right psychology it will be very hard.


In addition to these, I have also learned that one should take responsibility for the trade. With that being said, Warren Buffet's
Never lose money
rule is just a lame excuse for the lazy trader who doesn't want to take responsibility of a losing trade that he/she has put up.

Think stop loss as a cost of doing business, like transportation expense or payment to the staff that you just fired after sleeping at a very busy day at the office, which of course you could easily gain back by doing better business/hiring better staff the next time around.

The only time you will actually take a loss is when you put up a trade you didn't bother to plan or worst, didn't even think when you put up the trade.

London Metal Exchange: Nickel

I think it would be very helpful to monitor nickel price in the world market in correlation to NIKL price movement (since watching the development of nickel price in the world market added conviction in staying with the trade).

Here's the updated graph after 4 days:


CASH BUYER 27,775.00
CASH SELLER & SETTLEMENT 27,780.00

Friday, February 4, 2011

Megaworld Corporation (MEG)

6-Month Daily Chart


After four months of moving sideways wit downward bias, a bullish formation has formed on the daily chart in the last couple of weeks: Ascending triangle.

Although an ascending triangle is more commonly seen as continuation patterns, there are times that it usually serves as a reversal pattern.

Breaking the resistance of the pattern at 2.20 would suggest a target of 2.40 in the short term.

Short-term upside potential : 9%

Long term upside potential : 29% - Breakout point 2.20 to 6-month high at 2.84.

*Formation of lower trough could simply mean a trading range.

Filinvest Land Inc. (FLI)

6-Month Daily Chart


Now that the initial condition of the system - formation of a higher peak -
is triggered today, the next condition is wait for a correction.

Optimal entries:
50% Fib retracement: 1.10
Gap support : 1.11-1.13.

Initial target will be placed at the new resistance at 1.20.
Immediate upside potential : 9%.

But with the fresh signal, 1.20 is highly likely to be taken out.

Long term upside potential : 36.36% - Lower end of entry 1.10 to 6-month high of 1.50.

**However, prices dropping back to 1.01, despite of looking attractive because of the false notion of "cheaper", would appear to be bearish as it could cause a formation of a lower peak again thus forming a bearish continuation pattern.

Also, the formation of lower peak is a system sell.

Lower? Lower?

The market today closed lower by 16.20(-0.42%) points, closing lower at 3872 despite the fact that other Asian markets are up bu well over 1% as of this writing. The good thing about it is that the volume traded today has dropped significantly to 2.7Bil from 3.4Bil yesterday. Drying up of volume would suggest that sellers are running out of shares to sell already and the index could turn around back to heading up in the short term.

NIKL broke the previous high of 21.20, closing at 21.40 forming a new high despite of the weaker RSI reading(bearish divergence). I still haven't closed my position as it appears to me that it is in a strong uptrend. I am just expecting it to be one choppy ride.

Nickel is up since my last post(27000), approaching 28000 levels already. An up break at 28000 would probably send the contracts up to 28500 in the short term and hopefully, it could push the stock up in the short term.

SMC and AGI are looking attractive at current levels. Let's see how they do next week.

I am 50% cash so I would either put up a position in AGI or SMC. Or would it be better to put up a position in both issues. Or I could put up another position in NIKL for swing trading.

Good omens for the three are showing up!

Thank God there's 2 days to think over what I need to do by next week.

Here's something to watch over the weekend:

http://www.youtube.com/watch?v=CHUaQmexJFM&feature=player_embedded#


That's pretty much applicable to every tradable issue available.

Thursday, February 3, 2011

Nickel Asia (NIKL)

NIKL 10-Minute Intraday Chart


Add more?

San Miguel Corporation (SMC)

SMC Daily Chart Update

Nickel Asia (NIKL)

NIKL Daily Chart Update


It also appears to be forming an ascending triangle with a breakout point at 20.80.
Target of the pattern is at 22.70.

Alliance Global Group (AGI)

AGI Daily Chart Update

On Chinese New Year

Everyone was waiting for the rally of the Chinese New Year today, the way everybody was waiting for the Santa Claus' Rally last December. Unfortunately, like Santa Claus who got stuck in the chimney, the rally never came and the market walked away today with a small scratch, losing 2.52 points only with relatively lower volume than the average turnover as today's turnover only amounted to 3.4Bil. Foreign selling amounted to around 500M today. Running out of shares to sell to push the market further down?

I added FLI and MEG to my "short" list last night but with the way those 2 performed today, I moved them up to my watchlist as FLI formed a higher peak today. Although the new peak wasn't sustained up until closing, it still closed higher from the previous one at 1.18. Now, I am looking to enter a position near 1.10 or preferably lower but I feel like the closer to 1, the safer.

On the other hand, MEG seems to be forming an ascending triangle at the bottom of its downtrend. I am not exactly sure though if this type of pattern works as a reversal or not.

SMB seems to be a good candidate for trend following. Not in the marginable list though.

I didn't touch SMC today as I was unsure on what it's doing. Forming a symmetrical or ascending triangle? Anyway, both are bullish patterns so I think I would probably get in once 180 is broken.

Still patiently waiting for AGI.

It seems like bullish harami are pretty much reliable for short term profits/technical bounces/strong downtrend. They seem to ensure a minimum of 5% gain in our market.

Yehey NIKL! I have no idea why it was being sold down early this morning, specially by R&L SEC. Looks like the guy got burned shorting the stock today. The other one that is selling relentlessly this morning is from INTRA-INVEST SEC so I decided to track his entry. Tracking back up to the issue's IPO(11-22-10), it appears that they have an average entry of 16.62. With that in mind, it would be safe to assume that they are just taking profits.

Interestingly, LARRGO SECURITIES(193) has not sold any shares they got at 17. Are you guys waiting to double your money?

At the start of 2011 up to date, MACQ has not sold any share that they got at 19.36(average) while ATR seems to be pushing the stock up so he can unload at a much higher price.

Anyway, here's just to see what I am talking about R&L shorts today :


Also, it would seem that I was right in reading the Nickel's price in LME.

CITISECONLINE has also released a research saying that NIKL's fair value is at 22.49 with a possible upside of 26(which I am guessing in the medium term).

*I think the full report was taken down...
*I think the reason why I am always unsure with my open positions is that I always put up a relatively small position that I always get shaken out by noise.
Will start a larger position in the next trade.

Alliance Global Group

Short the market: Open position


Sold 8500 shares at 11.72 (doji).

Trailing stop 11.50

Stop loss: .20

Cover shorts at 11.40-11.30

Short the Market

Playing the hypothetical "short the market" game.

Standard short selling rules(can keep short positions overnight).

Initial Equity: P500k
Maximum open positions: 3


*Once the hypothetical account gets blown up, time to go long on the real market.

Open Short Position:

AP 4000 shares at 27.15 - down 0.05% - stop loss 5%
MER 1000 shares at 119 - stop loss 5%

Aboitiz Power Corp (AP)

Short the market candidate:


Sell 4000 shares once prices break below 26.90(26.80).
Double up positions once prices break below 26.20(26.10).

Trailing stop at 24.50-24.15.

Cover short positions at 22(Symmetrical triangle target: 22.10)

Stop loss 5% on average entry.

Philippine Stock Exchange Index (PCOMP)

Wednesday, February 2, 2011

Interesting Candlesticks

While scanning for trade setups today, I found these interesting candlesticks that I have never seen before - during the run up and in the books. I just saw them today - during the downtrend and dead cats:


All of them showed at the bottom(downtrend) and I have no idea what they mean.

Moving on through my scans, I found yet another sample of the candlestick formation which is older by 3 days:


Does it mean reversal? Forming a base? Or bearishly consolidating at the bottom?

Let's make it more complicated. I found the same pattern on an issue that has moved up:


It looks like a dark cloud cover, only this time, it's not a dark cloud.
Not a bullish engulfing.
Not a piercing pattern.
Not a kicking pattern.

If none of the above, what could it be?

Oh and volume is pretty heavy on the long white candle.

I think I just found out another way to complicate my trading!

Foreign Activity

NFS for today amounted to around 340M. That's 1Bil NFS in two days. Since the foreign brokerage houses can short on their own, they are probably covering up today.

Foreign selling is still very heavy in BDO with another 220M(180 yesterday) while the second heaviest foreign selling yesterday FLI turned around today with 49M NFB.

Foreign buying has also began in certain issues today like AP with 81M, FLI 49M and CEB 48M.

If the foreigns stop depressing the market, we could actually climb a little higher in the short term (so they could short again with better gains).

And today I was like...


I sold MER at 228 today hence the picture. I made some profit from it anyway but could have gotten more if I sat still and wait until the closing before selling.

I already wrote a plan to sell it at 240. Way to follow your plan.


*Positions opened up at the closing should be sold either on the next day's opening rush or at the closing, not during mid-sessions.


Sold LC for a loss too during mid-session despite heavy buying of Wealth, JAP and Regina these past few days. I'll be damned if it moves up tomorrow which is highly likely as a doji has formed today.

Sold SCC for a small loss plus commission.

So there, with the 1.58% gain of the index today, I closed all positions that hardly gave profit. Turnover for today dropped to 4Bil which is lower from yesterday.

AGI tried to break out of 12 today but could not sustain the strength until closing so I guess it is going to head a little lower by the end of the week. I would have put up a position in it had it closed higher than 12 today.

ATR seems to be gobbling up NIKL shares at 19.90 to 20 levels this past few days. Hopefully it will do good to the issue in the short term.

For now, I am just waiting for trade setups in SMC, AGI and NIKL. Will post useful charts(hopefully) later.

In a downtrend, the right thing to do is to open a short position. Opening long positions would be illogical. So with the "long only" market that we have, what's the right thing to do now? Yep, that's right.

*With the market moving down, I am going to play a game called "short the market". I'll look for certain issues to short hypothetically. Short positions would last longer like regular short positions in global markets instead of the 1-day-only short in our market.

Global Markets

US and European markets closed more than 1% higher. DOW is back to 12k levels.
Nikkei and Topix are also up by more than 1%.
Baby Jesus let Index rebound today.

Tuesday, February 1, 2011

Nickel Price Graph

No idea if this chart could be read the same as reading stock charts or if this is the right chart at all but I am going to post it anyway:


IF it can be read the same way as any other stock charts, price breaking out of reversed head and shoulder would suggest a target of 28500.

That would be good for NIKL right? Just keeping my hopes up! Anyway, it is definitely trending up. Still good for NIKL right? Right?! Haha

**European markets are up by almost 1% as of this writing. Asian markets closed slightly higher. Hopefully the market recovers tomorrow(despite of the fugly chart).

Foreign Activity

I was browsing the quotation report for today and I only found 4 stocks with significant foreign buying:

PNB with 7M down today
AMC 8.9M unchanged
EDC 15.5M down today
PLDT 47M down today

While 2 issues got heavily battered with foreign selling:

BDO 112M NFS out of 180M worth of trades
FLI 97M NFS out of 130M worth of trades

Net foreign selling amounted to more than 700M today. How much they pulled out of the market, I lost track and I really didn't monitor the overall market's foreign activity, just on specific issues.

Free falling

The GDP report hardly gave the market a push, opening with a high of +15 points before sliding down, completely losing 50.98 point at the closing. If the market drops another 50 points tomorrow, 3800 levels with definitely be taken out. When that happens, I think it would be much safer to liquidate all positions and wait until the market falls to 3600 levels before bottom fishing. The only consolation for us is the turnover during the slide today is lower than the previous days.

Blue chips are simply free falling today. There's hardly significant gainers for today except for TA +5% with 27M worth of trades.

NIKL is break-even with doubled up position from the starting position.

LC is hanging by a thread. We'll see tomorrow how this one will go.

SCC looks very ugly with the bearish engulfing candle today. I also feel like the ascending triangle formation is already invalid but it seem like it is now forming a symmetrical triangle. The accompanying volume doesn't seem to fit the pattern though.

SMC gap is almost filled so another round might be just around the corner.

Still waiting for AGI to drop further.

AP is getting ready to break down.

I put up a small position in MER today. Hoping for a stronger cat to bounce. Macquarie just seems to be on a selling spree.

GDP for 2010

Hopefully the 7.1% GDP growth of the fourth quarter last year is enough to produce a technical bounce today.

http://www.bworld.com.ph/content.php?title=Strong%20growth%20for%202010&id=25527

Monday, January 31, 2011

Nothing much.

Besides the fact that the index got severely murdered in today's trading, nothing much happened in today's session. The index wasn't spared from the turmoil overseas(Egypt), closing 2.24% lower from yesterday. As of writing, Asian markets are down by more than 1% so that still makes us the biggest loser, second to NASDAQ's drop last Friday at -2.48%.

The drop was led by TEL -0.73%, AP -5.29%, MER -6.93%, BPI -4.98%, AC -5.29%,
SM -3.89%, AGI -2.71%, and MBT -2.55%.

Panic selling was seen everywhere. My core stock - NIKL - experienced its heaviest drop today, dropping to 19 before closing 19.54, 4.68% lower from yesterday.

The drop today left huge gaps at (20.50 and 20.10) and (19.90 and 19.70) visible on the 5-minute candlestick chart.

I am expecting the gap at 19.90-19.70 to be filled in the next few days but I am having doubts that the gap at 19.90 will be filled immediately.

I put up another small position at 19.44 today.

SCC is very heavy, closing almost unchanged at 198.90 - my original entry. I am hoping that it rebounds in the short term as Oil is starting to move up again.
It looks like it's forming a symmetrical triangle on the daily chart.

Yikes with LC. Timing of entry is a little off but the stock is moving within expectations. Rising method candle pattern on the weekly chart.

I couldn't make anything out of SMC so I wont be touching it in the short term or until it fills the gap.

AP seems to be forming a symmetrical triangle pattern(bearish) on the daily chart.

I am patiently waiting for AGI.

The game has definitely changed. Dead cats, anyone?

Friday, January 28, 2011

Trading plan

Here is the trading plan that I made for this past week:

Avoid/Sell holding and industrial stocks.

Buy financial and property stocks for oversold/technical bounce play.

Buy mining stocks for bucking the short/medium term downtrend but be extra careful.
Check for bearish rsi divergences to spot weakness as weakness has already starting to surface.

Take positions in leaders.

MEG in property sector.

NIKL/LC/SCC in mining sector.

General market short to medium term trend is down.


I never took position in MEG but in SMC instead.

I told you so.

I was judging SMC strength the entire time today on to whether I would sell it or not by watching the price action and the 5-minute chart. There seemed little appetite for shares above 178 so I sold mine to lock in profits.

Although there were only few shares asked at 176.50, nobody wanted to take it and everybody was just waiting at 176. This is after I already sold my shares to the market. Then it was bid up at the closing back to 178. But the charts never lie, and I saw a symmetrical triangle on the 5 minute chart breaking down suggesting further decline to 169.50. RSI on the 5-minute chart looks pretty ugly too so I am just simply waiting for it to get oversold before getting back in.

I probably should not add up positions after they gap as I should be looking to "fade" the gap instead.

NIKL seems like it is poised for another correction, probably up to 20.30 before heading back up. 5-minute uptrend line is holding up so far.

A bearish RSI divergence appeared on the daily charts though. However, the divergence happened below the oversold levels so I'll be taking it as a normal correction for the mean time.

SCC just moved sideways today. A convincing break of 203 will point to advance/s in the short term. What I hate with the stock is its ROC is pointing up while its price is simply stagnating at the current levels.

I put up a position in LC today at the closing.

MA and MAB broke out of their consolidation channel. MA closed at its resistance which I believe will not be broken as the RSI reading is already on the overbought levels. The main problem of this kind of issues is they are highly illiquid meaning minimal public participation rendering technical analysis useless as the analysis is used to gauge/predict herd mentality.

It's going to be a different story if both starts to trend up again.

I hate to say this but I told you so. Somebody is shooting his foot in AGI - talking about the short term.

So there. Ending up the week with mining stocks and recovering costly mistakes by playing with the third liners.


**I was also became anxious of closing "weak" positions as my Uncle called me to buy BEL and LND. Somebody who doesn't know how to trade is telling me how to trade. How ironic. Guess what happened to both issues?

Thursday, January 27, 2011

Breaking free.

Well, what do you know. SMC shoot right up today because of the news of the offering will not be postponed and now priced at 200-250. Coincidentally, the gap today points to 211 as a target in the short term so I'll be keeping this one for a while. I also increased my position today.

I put up a position in SCC today at the closing.

NIKL showed alot of hot love today, peaking at 21.20 before closing at 20.90, also filling the intraday gap(5-minute)at 20.80. Data on my previous analysis of the chart is updated 'cept for the chart.

SOLD APC for a loss today.

SOLD AGI at 11.96. I was being stupid and greedy that it will push higher into mid-12s today while my analysis is just pointing at 11.98 so I sold a fluctuation lower.

ATR was very active in this stock today but I don't think I am willing to bet on them yet. There was also a huge cross by UBS. I am skeptical with this cross sale as I feel like cross sales at the top end of the range is distribution. Or maybe I am simply being paranoid.

Still holding ELI. What a sucky position. I want to break free.

The index might meet resistance at 4090 in the short term so that leaves us with 2% gain in one day(doubt it) or 1% gain in 2 days which would mean that the resistance will be met by Monday.

*Heavily monitoring the Index as I am only comfortable trading index issues.


***I just got the daily quotation report and have I read it right? Around 1B NFB?!

Risk-Reward of closed trades

Updated on every closed trades

Closed trades:

1/05-1/06 CYBR 1:0.61
1/11-1/17 AGI 1:3.5
1/12-1/20 CYBR 1:0
1/20-1/27 AGI 1:3.5
1/17-1/27 APC 1:0
1/27-1/28 SMC 1:2
1/18-1/28 ELI 2:0
1/27-2/02 SCC 0.1:0
1/28-2/02 LC 1:0
2/01-2/02 MER 1:0.1
2/02-2/11 SMC 1:0
2/08-2/11 AGI 0.76:0
2/07-2/14 AGI 0.24:0
Open position/s:

1/12/11 NIKL 1:0

San Miguel Corporation (SMC)

Latest open position:

Lepanto Mining (LC)

Wednesday, January 26, 2011

Sucker market.

What a sucker market. Good thing the bombing yesterday didn't have much effect in today's trading.

I feel like somebody is going to shoot his own foot in AGI this week. He started shooting when locals started to buy it up to 11.80. I was looking at the 5 minute chart and the gap at 11.80 has been filled already. Next gap is at 11.94.

There was a tug of war in NIKL at 19.98. Looks like the bulls won - for now.

LND sure does look interesting.

LC is already at its uptrend support line. Expect to test 0.561 in the short term.

Changing trading strategy to properly suit up this kind of market.

Tuesday, January 25, 2011

There was a bombing incident at Ayala this afternoon. Hope this doesn't affect the market tomorrow much.

Start of the emotional rally?

Looks like the market just started its recovery. It feels like an emotional rally after 5 days of heavy bleeding. I am expecting immediate resistance at 4200 levels.

Every position in my portfolio started to recover today as well. AGI is the only one acting retarded in this strong market. Annoying little bugger. Sell on rally. Formed another doji today. Possibly gathering enough strength to challenge 12 again.

APC is got bid up again today with 10M shares. Although it has closed unchanged(doji) today, with this market you'll never know so I'll be selling on rally and take some money off the basura table.

MEG is showed a strong recovery today. Too bad I didn't have the balls to catch some falling knives yesterday. It could go up to 2.40 and 2.60 at most in the short term.

JGS started its reversal today. Will buy on higher trough formation.

Bought SMC at the closing and looking to range trade. Will continue to hold if it breaks 180.

Monday, January 24, 2011

Penetration of 3896: Spring or sign of impending doom?

The index is hanging by a thread already from the support at 3896 which was also penetrated in today's session. Luckily, the market slightly recover at the end of the session closing at 3902. From the looks of it, we just entered the oversold levels.

Note: Oversold levels can remain oversold on a downtrend and vice versa.

"Good news" from the overseas doesn't seem to have effect on our market. The drop is probably about inflation.

There were hardly notable gainers for today except LPZ gaining 4.4% MER with 3.42% and SMPH with 2.50%, completely bucking the trend. Major losers today are the previous week's third line gainers.

Well today I simply sat tight and watched the ticker as panic selling ensues at the opening, recovering slightly by mid session and closing lower by the closing.

AGI closed unchanged today, forming a doji on the lower end of its trading channel which I am assuming that the candlestick is bullish as it is also accompanied by low volume(selling pressure is easing out).

There were crosses at the closing by CLSA. ATR chumped on a huge volume at around starting at 11.12.

NIKL might continue to correct in the short term as suggested by decreasing ROC. A bounce from 50 RSI levels is probably a good entry.

The third line issues did what I was expecting them to do(to disappoint) so
I am just waiting for the stops to be hit. Or sell on rallies.

I made a trading plan on CPM, PAX, MEG, and T over the weekend. Everything are going withing expectations but I decided not to execute the plan and put on additional positions at risk until I get out of the weak positions on the third line issues.

PSEi: Doomsday scenario

As the moons of Mars and Earth align, just kidding.

Possible scenario for PSEi if it completely breaks down from support:


Fire burning on the dance floor

Everybody is running towards the nearest exit.

Previous all time high at 3896 is broken. Next is 3820. Doomsday scenario is happening?
Bullish failure swing on CPM? If yes, bound for a reversal.

Friday, January 21, 2011

Yikes!

Alot of bearish RSI divergences on the weekly charts. PSEi breakdown from support.

Hold your breathe and take the dive at 3800~

Sideways to down.

The PSEi did took the center stage as it lost another 1.38% in today's session, beating western and asian markets with the exception of FTSE. The index has also formed a new lower high and lower low in the short term and it has also broken below the previous low of 3953 - 2 points lower. The market might continue to move sideways in the intermediate term with a downward bias.

It's been a long time since I went red. Yikes.

Got faked out in APC because of the 23M bid at yesterday's closing. It has formed formed bearish candlesticks this week - Falling method followed by a bearish engulfing pattern. However, weekly chart is telling other wise - a long white candlestick and MACD buy signal so the weakness in the daily chart is probably a buy. For the past year, its weekly MACD buy signal works so I am still giving APC a week or two.

Also got faked in AGI. Weekly and daily chart looks very ugly. Should have taken whatever money it gave this week.

ELI started its recovery today. Spinning top after a decline would suggest sellers are losing control. ROC has also started to turn up so I am guessing it's about to advance in the short term. Weekly candlestick is showing a large doji which is bearish. Hopefully it opens higher this week.

NIKL is probably on correction mode.

Waiting for SCC to bounce before getting in. It seems like its going to consolidate in the short term within +/- 200 range.

AP seems to be forming a symmetrical triangle pattern(?). Also forming three stars in the south candle formations and RSI is back on its old support(39.59). Daily signs are mixed so I am not willing to bet on it yet.

Probably best to wait for:
1. Higher high (since it seems like to have formed a higher low already).
2. RSI bounce from 52 in the weekly chart.

All of the stocks that I am currently holding seems to have a normal bid/ask at the closing except NIKL which has 200k shares at 19.98.

RSI buy signal does seem to work on a 5-minute chart if the stock is range trading.
Asian markets down by 1%+. PSEi time to shine?

Thursday, January 20, 2011

Nickel Asia (NIKL)

NIKL Daily Chart


From the looks of it, it is still a long way to go.

The higher end of the IPO price is my long term target.

Lepanto Mining (LC)

LC Daily chart:


The chart says pretty much everything. Possible range trade and trend with it.

Bleeding index is bleeding.

I am proud to say that everything I lost on the basura plays lately(plus the paper loss in ELI), I recovered back today with NIKL. NIKL is the superstar in today's session as it is bucking the Index lately. I completed my initial position in NIKL today. I wanted to add more but I didn't want to pull my average entry up too much. I will be waiting for a correction from 22 before I start adding up again.

Sold CYBR for a loss as my stops are hit during the early morning surge/slide.

APC has started to advance and it has now broke and closed above its resistance at 0.89.

Although ELI is still trading within expectations it is still losing(disappointingly). I'm still keeping it(prolonging losses) as it is somehow forming a bullish candlestick reversal pattern: Three starts in the south. Let's see how it goes in the short term.

Short term trading setup appeared in MEG and SCC. I'll toss a coin which one to trade tomorrow as I still have some cash after buying AGI for another quick range trading.

I'll post the chart of LC later as I couldn't get the clearance to trade it because of "moral issues".

The index lost another 33 points today. This suggests that the selling pressure is easing up and we are just about 6 points higher from the psychological support at 4k.
Let's see how things go tomorrow.

Wednesday, January 19, 2011

Reminder for the whole year

Always stay with strength.

Price movements make news, not the other way around.

Now, go look for a strong stock!~

*Only problem now is I am seeing alot of bearish RSI divergences on most of the stocks that I am currently monitoring. Most of them could still advance but only in the short term.

**Western markets are dropping btw.

Filinvest Land (FLI) and Megaworld Corp (MEG)

FLI weekly chart:


The setup that I will be looking for before putting up position in FLI is a setup similar with the red circle, an sign of recovery in RSI after the huge drop pointed out by the bearish divergence in RSI.

We already have the huge drop in play. Waiting for sign of recovery. Profit taking would be somewhere at 53 RSI.

MEG weekly chart:


Same game plan with FLI. RSI 35 would seem to be a good place to start catching falling knives. Looks like there is still possible downside in the short term.

Both have hammer candlestick formations. However, I have bad experiences with red hammers without confirmations so I am still not touching them until signs of recovery.

APC Group Inc (APC)

I know I shouldn't be buying the stock first without studying its chart but I already did bought without proper research so I'll study the next position that I'll be taking.

Anyway I was trying to convince myself that buying APC was right. I think I found one:
*Bad trading habit!

APC 5-Year Weekly Chart:


1. Clearly that the major trend is up.
2. Price is currently trading(resting) at its resistance at 0.89.
3. Fresh MACD buy signal.
4. RSI reading is still not overbought.

With this being said, I might still have a couple of weeks for it to climb up before starting its really loooonnnnggggg consolidation.

Prices are poised to break that 0.89 resistance levels as the current RSI reading neutral(not yet overbought).

Once 0.89 is broken, I am expecting it to test the psychological resistance at 1 which I believe will be taken out(biased lol). After breaking the psychological resistance, 1.28 would be the immediate target.

I would close my position if:
1. price meets strong resistance 1.28;
2. weekly RSI hesitates at 75-78.

Strongest weekly RSI reading is 90(1.28).

Now that I found reasons not to be shaken out, I can sleep soundly at night again. :)

I'll study the charts before putting up a trade next time, promise!

Alliance Global Group (AGI)

Here is the weekly line chart of one of my favorite stock to trade - AGI:


*I used line chart to see the formation clearly although the pattern is also visible in the bar and candlestick charts.


It appears that a head and shoulder formation has formed on the weekly charts - which is very hard for me to ignore.

Book definition of head and shoulder pattern:

1. Needs a prior trend to reverse.
2. Left shoulder that marks the high point of the trend.
3. Head forms as a higher peak forms, exceeding the previous high. After peaking, the low of the subsequent decline marks the second point of the neckline. The low of the decline usually breaks the uptrend line, putting the uptrend in jeopardy.
4. Right shoulder forms as price advances from the low of the head which is lower than the head. The decline from the peak of the right shoulder should break the neckline.

5. Neckline forms by connecting the two lows.

Neckline break(most important part of the pattern): The pattern is not complete and the uptrend is not reversed until neckline support is broken. Ideally, this should also occur in a convincing manner, with an expansion in volume

6. Once the support(neckline) is broken, it would now turn into the resistance level. Sometimes, but certainly not always, the price will return to the support break, and offer a second chance to sell.

7. Price target is projected by measuring the top of the head to the neckline. The distance is subtracted from the neckline to reach a price target. However, the price target should only serve as a rough guide. Other factors like previous support levels, Fibonacci retracements, or long-term moving averages should also be considered.


AGI Chart Analysis:

1. Check.
2. Check.
3. Check.
4. Check.
5. The two lows(green circles) are pointing at 11 as the neckline. Price breaking and closing below 11 would complete the pattern.

Initial target after breakdown: 9.04 (9)
Resistance after breaking down: 11

Will it break the support? RSI reading gives the clue on possible price movements in the short term.

Tampons for the bleeding.

The selling eased out in today session, dropping lower by 33 points in comparison to yesterday's 76 point drop. It feels like we are going to find a higher low tomorrow.

The index looks like range trading from 4000-4200 levels. I think I just got my wish granted. Hopefully, index issues provide a significant range to trade.

NIKL, the current star of my portfolio, has finally broken out convincingly out of its previous high. It has also broke its psychological resistance at P20 and it is now trading at its all time high.

I put on additional position in NIKL today(+30% of my current position) and I am still not done putting up the whole position.

My position in APC has started to recover today and looks like there would be continuation. If P1 is taken out tomorrow, I believe it would be safe to assume that it will continue to advance further in the short term as suggested by RSI.

Positions in CYBR and ELI are both bleeding today. ELI tried to fill the gap today.
Buying opportunity on CYBR tomorrow(?).

My timing in my recent positions in APC, CYBR, and ELI is terrible. Position sizing is saving me though.

It feels like something is brewing in MER but still no guts to buy. I would probably trade it once it break 300.

SMC filled the small gap at 160-162 last December 28, 2010. Resistance at 189.
Range trade?

I'm going heavy on mining. There is this one mining issue that I have been monitoring secretly and looks like it is also going to break its most recent high. It is a highly despised stock but it is quietly trending up.

Are people still fearful or superman effect has started to surface?

*Buy at the closing on red days and sell on panic buying days on third liners?

Tuesday, January 18, 2011

Basura Plays Update

APC:


Formed a lower peak after a double top.

*Should have waited to break the double top before buying?
Possible support at 0.80.

Dark cloud cover candle on daily charts.
No RSI bearish divergence.
Normal correction.

ELI:


Formed a lower peak followed by an accelerated break down of the uptrend line.

*Should have waited for a sign of recovery before buying?

Possible Support at 0.70
Dark cloud cover on daily chart.
Bearish RSI divergence on the daily price.


SINO:


Formed a lower peak followed by accelerated decline but found(?) support at 0.43.
Buy if 0.45 is taken out.

Dark cloud cover candle on daily chart.
Bearish RSI divergence on the daily price.


*Note to self: Buy at the closing on red days and sell on panic buying days?

Stop the bleeding.

The market lost 75 points in today's trading. Major losers are led today MEG, MBT, MER and SM.

Bought APC and ELI today. Terrible timing I say as they both end up with paper losses. Good thing I only risked 1% on both position. Still doing it the wrong way. Anyway, I'm still going to try to learn how to trade them.

I closed my position in MBT at 64.40 at a loss. I closed my position in AGI at 12.02.

I thought I was seeing a falling method candlestick formation plus bearish RSI divergence in CYBR so I was really skeptical with it.

AP is looking to move sideways with downward bias(?).

Charts for the third line plays later as I am having trouble loading the charts. Let me see what I should have done.

Monday, January 17, 2011

Aboitiz Power Corp. (AP)

This is the reason why I am still a little skeptical with AP:


Optimal buying window for AP is when it forms a higher trough.

Basura Plays

The main reason why I fail every time I buy third liners is because I don't know how to trade them properly. From the previous trades that I did, I would usually put up the same size of a position the same way I put in blues and second liners. I also put up the same stop loss point. With the erratic behavior of third liners, my stop always gets hit. I am out of the trade and then stock resumes its movement.

Now to solve my problem, I decided to put up a relative small position in third liners when trading with the same amount of capital at risk.

Position sizing is probably the answer to properly gamble on illiquid stocks.

*Word of caution: I am just trying out this idea and I have no idea if this will work. Please always do your own research before taking up positions. Caveat.

**Currently using the crudest form of technical analysis: Trend lines. No other technical indicator is being used as I find them highly unreliable when day/momentum trading. RSI and MACD bearish/bullish divergences doesn't seem to work in intraday charts as they would work on a daily chart.

(If you have better ideas on how to trade this kind of issues, please let me know, it will be greatly appreciated.)

Okay, moving on, using intraday charts to trade:

APC: Breaking out at .89 should be a buy.


ELI: Consolidating at its high. Range of consolidation is at 0.79 to 0.82.
Buy at 0.79. Buy on breakout(Resistance 0.82). Buy on pull back/bounce to/from resistance at 0.82.


SINO: Broke out of trading range 0.38-0.43. Currently heading for correction and looking to test 0.43. Buy the bounce from 0.43.


SUN: Possibly forming a symmetrical triangle. Buy at 0.58 for anticipation breakout.

Skeptical/Neutral

Sold AP today for coffee money. Still being shaky with AP because I only bought it impulsively. Still wait for it to form a higher trough.

Currently holding AGI, CYBR, MBT and NIKL. I also sold several shares of MBT at 65.20 today because it's being a laggard and to raise funds for a possible trade for this week.

I am pretty much disappointed with the recent movement MBT. Good thing I sold some MBT at break-even as it continued to fall intraday before closing at its low. Right now, NIKL and MBT are cancelling each other out in my port! :))

I am skeptical with AGI's closing today but I still don't have a signal for profit taking. ROC is still poiting towards further advance in the short term.

I am also skeptical with my position in CYBR as I don't know how to trade it properly but since it is now showing profits, I will simply hold on to it in the mean time.

I am still neutral with NIKL as it simply continues to move sideways. ROC is now pointing up so this could probably point out to further advances in the short term.

Still trying to learn how to trade using intraday charts. Currently studying 5 minute charts for timing/day trading(in the future).

So in conclusion, I am still skeptical to neutral with my current positions.

Sunday, January 16, 2011

Philippine Stock Exchange (PCOMP)


Looks like the market is poised to move sideways for the meantime after sliding down big time (as pointed out by the bearish rsi/price divergence) from the recent top at 4400 levels. However, the index seems to be moving higher this coming week as suggested by the strong closing last Friday with RSI seeking to break above 50.

Volume indicators reflect moderate flows of volume into the index indicates mild bullishness in the short to medium term.

Short to medium trend: Sideways to up.
Support: 4000 levels
Resistance: 4300 levels

Breaking and holding up above 4300 levels would suggest the resumption of the uptrend.