Sunday, December 5, 2010

Weekend Update

Looks like we did find the bottom last week. However, profit taking occurred in several stocks that went on a bargain sale few weeks before. Are we going to continue heading back up now? I think so as to what I am seeing on the weekly chart(red circles):


Although we could still experience some choppiness early this coming week.

Looks like I was right with my AP reading(for short term) as profit taking surfaced during mid-session, giving up 1.12% at the close, closing at 35.40.

Intermediate trend is still up so no worries for AP right now, as being suggested by its weekly chart.

AGI gave off a take-profit signal(short term) for Monday. Looks like the pattern needs to wait for a little longer.

DMC is looking to break above its downtrend line! Hopefully, no major profit taking for those who bought at the recent low so the price won't be pushed down just yet.

AP is up by 30.78% within 29 trading days.

Thursday, December 2, 2010

Trade Setup: AP - Status: Open


The red box indicates where I initially believe that the price will head back down again as it broke down from its support - which I believed it should not so I didn't buy yet. However, I was wrong in my analysis that time so I decided to be on the right side of the market: Buy and go long.

B1 = First set of buying was staggered: First part was done @25.85. The buying during the entire session was strong I decided to chase it and got the second part @25.95.
It closed at 26 - the buying of the stock was immediately proven right as it immediately showed profits.

B2 = Second set of buying was also staggered: First part was done @28. The buying during the early part of the session was strong so I decided to chase it and got another set @28.25. However the buying was unsustainable, and it closed lower at 27.90, indicating that the timing of my buying that day was terrible. I let it run though as the reason for buying that day was still valid.

I was trying to buy a cross over of price below the 10SMA. However, price never dropped below it so I bought as close to 10SMA as possible.

Earnings report is the other reason why I took position.

Initial personal target price was 35. However, personal tp was reached and breached today so I am extending my holding period further because two foreign brokerage houses bought a large amount of shares on the market.

ATR buying: The day ATR buying was evident.
Deutsche buying: The day Deutsche buying was evident.

ATR buying has also formed a hammer candlestick(bullish indication) and price opened below the 10SMA but closed higher. It should have provided a good entry for a short term trade - if you weren't too afraid to buy.

The red circle on the MACD suggests a short term take-profits signal.

The red asterisk on the rate of change would suggest short term peak.

TOP 20 Buyer-Seller:


The image of the top buyer/seller is to see who's getting in and who's getting out within this past 3 days.

General trading plan: Sit tight and let the profits run wild.
Lesson in this trade: Averaging up works; always buy what's showing strength;
and don't be too quick to take your profits. :)

The big question: Will AP continue to advance in the short to medium term?

Well, you wouldn't know until you bet.

So, are we there yet?

The market bounced strongly today, gaining 146.02 points, closing higher by a whopping 3.65% at 4148.90. Looks like we did find a bottom yesterday:


The market bounced from the 2-year uptrend line(1) which I believe the major uptrend line. RSI needs to form a higher low to indicate the strength/bullishness of the trend.

Looking at the PSEi weekly chart:


As we can see, the crossing of the faster line below the slower line(MACD - red cirlce) indicates that the recent decline in the daily chart is simply a correction and RSI is still normal - meaning no bearish divergences or what so ever is visible on the chart as of this moment.

We can conclude from this that the uptrend is still intact - for the mean time- up until the current uptrend line is broken.

AP. AP. What can I say? Nothing much as it is simply heading up after our foreign friends started to gobble up alot of shares in the market and I highly doubt that they would let the price fall below their entry.

AP gained a nice 7.51% today and the most active stock today while AGI is the second runner up.

Technically speaking, I have a screaming take profits signal for tomorrow for short term trading. As of now, I am trading AP for intermediate term already. My personal target of P35 has been already reached and breached so I am simply letting my profits run and go wild now.

AGI is looking to break out from its ascending triangle chart pattern pointing at 15.24 as a possible target although I think that my system will generate a take profit signal within 2 days but our foreign friends has also gobbled up a lot of this stock so let's see what's going to happen.

No short term trades for me as of the moment as I am trying to lessen the stress when trading.

Current position:


Within 28 trading days.

Sucker Play 101: DGTL

Here is a previous trade that went sour:


Buy 1: Bought it first at 1.68. My reason for buying it was the gap, that was pointing to 1.89 as an immediate target. However, the next day, it reversed closing lower and now pointing to fill the gap but I was being stubborn that time so I held to my position thinking it would be quick to rebound the next round.

Buy 2: Bought another set at 1.63 thinking it was the bounce that I was waiting for. However, just like the first trade, it reversed immediately the next day. The reason behind this second set was (1)I thought it was the bounce that I was waiting for; (2)Rate of change has started to point up suggesting an upswing in the short term - believing that it will reach the previous peak at P2; and the last but the most fatal error one could make in a trade: (3)Read on a forum that Abacus(brokerage) was accumulating because it has a "very good" earning report that is coming out come 3Q earnings report - which was also magnified by another guru saying that DGTL story is a turnaround story.

After 9 trading days, the uptrend line was broken so I decided to take the hit and cut loss to preserve capital and to avoid further loss in trading opportunities. I sold both positions 1.69 and 1.64 at 1.59.

The trade averaged a 6.84% loss to the entire trading capital.

Conclusion:

If I didn't take the hit and sold the entire position, I would still be incurring further losses as it continued to decline further up until now and I would have missed a very profitable trade that I have which is still open(Aboitiz Power).

Lessons from the trade:


(1)Never trade without a plan.
(2)Never make a plan after reading other people's analysis on a certain stock.
(3)Never trade on a tip. When there's a tip, there's a tap.

So the big question now: Is DGTL a turn around story? See it for yourself.

Don't be a sucker.

Wednesday, December 1, 2010

Traders Psychology and why 90% of traders fail

1) Anything can happen – there are always unknown forces and traders operating

2) You don’t need to know what is going to happen next to make Money - So long as you have an edge then the laws of probability will decide the outcome over a series of winning and losing trades. Market info is only threatening if you expect the market to do something for you. If you don’t expect the market to make you a winner every time you will have no fear of losing, if you don’t expect the market to keep going in your direction you will take profits off the table. If you believe this then how can the market make you wrong. If you believe anything can happen then you will always be right. If the odds are in your favour then every loss puts you closer to a win.

3) There is a random distribution between wins and losses for any given set of variable that define an edge. : If you believe this then you will be looking for anything that meets your criteria of an edge and jumping in without hesitation. If you still believe trading is about analysis for each loss you will be doubting your edge and gathering yet more info.

4) An edge is a higher probability one thing will happen over the other. The only evidence you need to gather is whether the variable you define as an edge are present at any one time. When you use other info you are adding random info outside of the parameters of an edge to your trading regime. This will create a random inconsistent approach that will lead to random inconsistent results. Why bother gathering further info, if the market is offering you a legitimate edge, determine the risk and take the trade.

5) Every moment in the market is unique. If each moment is like no other then how can you know what will happen next, so why bother trying to know. The best traders have trained their mind to believe in the uniqueness of each moment. If you believe in this uniqueness you will not associate and your mind will be open to perceive what the market is offering from its perspective.

You will enter “the zone” when you are tapped into the “now moment” opportunity flow. This will happen when you are at peace with not knowing what’s going to happen next and make yourself available to the market.


Trading in the Zone

Boring Update

The market recovered today after the huge drop yesterday caused by the selling of DBP-Daiwa of index issues, gaining 49.18 points back, higher by 1.24% at 4002.88 - back at the psychological support. Will the market start bouncing from here? Probably. Probably not. If the market continues to be weak, next possible resistance would be at 4120 before it starts heading back down. The next good thing that it would do is to retest the recent low at 3953 levels, before heading back up with the resumption of the uptrend.

On the weekly charts, the index is probably at the bottom already so if the index starts moving back up again here, that would be a better confirmation of what's going to happen next.

Looks like the buy signal that AP generated yesterday is good. A lot of AP shares are now in the market with an average of 32.80 and looks like the big guy is done accumulating shares already so I think they are going to pump the stock now.

Technical indicators are pointing up suggesting further advances in the short term, probably up until late next week or early the week after. However, I'm still assuming I'm wrong until proven otherwise.

AGI is looking great too as it is currently forming a ascending triangle pattern(bullish) with a possible target of 14.80. Price is currently at the lower part of the pattern which should have provided a good entry for those who have appetite for risk. For the conservative ones, an upswing in the weekly chart should be their signal.

AP is up by 23.02% within 27 trading days with doubled up position.

*Wanted: Metastock for christmas!

Tuesday, November 30, 2010

Are we there yet?

The market took further beating today, closing lower by 99.88 points, breaking the psychological support, closed at 3953.70 - 2.46% lower from last week.

The index is poised to decline further- short to medium term - as it broke 35 and 65 SMAs and it is looking to test the previous all time high in the immediate term:


However, it is approaching extremely oversold levels so a rebound is possible in the short term, probably late this week to next week. However, if it continues to decline further, be quick in pulling the trigger when your stops are hit.

The bearish divergence on the MACD should have been enough to tighten your stops.

Long term trend is still up as the Index still trending above the 200 MA.

Another information that we should look at is the NFB, which despite the 2%+ decline today, NFB today is worth 622M. (Is this right? AP alone already net 575M NFB).

AP was heavily sold down during the entire session, dropping to a low of 31 before recovering at the end of the session, closing at 32.80, slightly lower by 0.46% from the previous session. Volume traded was exceptionally high with 58M+ shares exchanged hands today, the most active stock traded for today.

AP generated a buy signal today. Tomorrow will be the confirmation if the signal is good.

Anyway, moving on to the big question this week: Are the big guys currently accumulating or distributing?

One more thing. As the market continues to decline further, we come up with different reasons to hold on to trades - specially losing ones. If your threshold for loss is hit, cut loss and move on to the next trade. If a stock is going down, there's probably a good reason why it is moving down. And I don't want to find out what's the reason behind the decline when it has already done a significant damage to my account.

Get out when your mistake is still cheap.

Bleeding portfolio as predicted by our favorite gurus? Well, mine's not. :)
AP is up by 21.17% within 26 trading days with doubled up position.

Saturday, November 27, 2010

Master the four fears - Lessons found over the internet

Merriam-Webster's dictionary defines fear as "an unpleasant, often strong emotion caused by anticipation or awareness of danger, going on to explain that fear...implies anxiety and usually the loss of courage." This definition of fear is useful in helping define the issues that traders face when coping with fear. The reality is that all traders feel fear at some level, but the key is how we prepare to address our concerns related to taking on risk as a trader. In this article I will review four major fears experienced by traders, and I'll take it a step further by noting how the outcomes of these fears create undesirable trading behaviors. Basically, my aim is to have you walk away with an understanding of these dangers so you can and implement strategies that will address your fears and let you get on with your trading plan.

Mark Douglas, an expert in trading psychology, noted in his book, Trading in the Zone, that most investors believe they know what is going to happen next. This causes traders to put too much weight on the outcome of the current trade, while not assessing their performance as "a probability game" that they are playing over time. This manifests itself in investors getting too high and too low and causes them to react emotionally, with excessive fear or greed after a series of losses or wins.
As the importance of an individual trade increases in the trader's mind, the fear level tends to increase as well. A trader becomes more hesitant and cautious, seeking to avoid a mistake. The risk of choking under pressure increases as the trader feels the pressure build.

All traders have fear, but winning traders manage their fear while losers are controlled by it. When faced with a potentially dangerous situation, the instinctive tendency is to revert to the "fight or flight" response. We can either prepare to do battle against the perceived threat, or we can flee from this danger. When an investor interprets a state of arousal negatively as fear or stress, performance is likely to be impaired. A trader will tend to ?freeze.? In contrast, when a trader feels the surge of adrenaline but interprets this as excitement or a state of greater alertness before placing a trade, then performance will tend to improve. Many great live performers talk of feeling butterflies just before they go on stage, and how they interpret this as a wake-up call to go out and perform at their highest level. That's clearly a more empowering response than someone who might interpret these butterflies as a reason to run back to his dressing room to get sick! Winners take positive action in spite of their fears.

1. Fear of Loss
Analysis Paralysis and Its Cousins

The fear of losing when making a trade often has several consequences. Fear of loss tends to make a trader hesitant to execute his trading plan. This can often lead to an inability to pull the trigger on new entries as well as on new exits. As a trader, you know that you need to be decisive in taking action when your approach dictates a new entry or exit, so when fear of loss holds you back from taking action, you also lose confidence in your ability to execute your trading plan. This causes a lack of trust in your method or,more importantly, in your own ability to execute future trades.

Thus, you can see how fear can set in place a vicious cycle of recurring doubt and, in turn, reinforce a traders' lack of confidence in executing new positions. For example, if you doubt you will actually be able to exit your position when your method tells you to get the heck out, then as a self-preservation mechanism you will also choose not to get into new trades. Thus begins the analysis paralysis, where you are merely looking at new trades but not getting the proper reinforcement to pull the trigger. In fact, the reinforcement is negative and actually pulls you away from making a move.

Looking deeper at why a trader cannot pull the trigger, I believe the root stems from a lack of confidence about the trading plan, which then causes the trader to believe that by not trading, he is moving away from potential pain as opposed to moving toward future gain. No one likes losses, but the reality is, of course, that even the best professionals will lose. The key is that they will lose much less, which allows them to remain in the game both financially and psychologically. The longer you can remain in the trading game with a sound method, the more likely you will start to experience a better run of trades that will take you out of any temporary trading slumps.

When you're having trouble pulling the trigger, realize that you are worrying too much about results and are not focused on your execution process. Make sure your have a written plan and then practice executing your plan.

Start with paper trades if you prefer, or consider trading smaller positions to get the fear of losing out of your system and get yourself focused on execution. When in the heat of battle and realizing you need to get in or out of a trade, consider using market orders, especially on the exit. That way you can't beat yourself up for not pulling the trigger on your trade.

Many traders may get too cute with a trade and try to work out of a position at a limit price better than the current market price, hoping they can squeeze more out of a trade. But as famed trader Jesse Livermore advised in the classic book Reminiscences of a Stock Operator by Edwin Lefevre, ?give up trying to catch the last eighth.? Keep it simple with a market order to exit allows you to bring closure when you need it, which reinforces the confidence-building feelings that come from following your trading plan. In the past when my indicators noted it was time to exit, I have experienced firsthand the pain of not getting filled at my limit, watching the option drop and then placing a new limit back where I should have exited at the market in the first place! Then I have realized I was not going to get filled there either, so I again kept lowering my limit until, in frustration, I placed a market order to exit much lower than I could have closed the position initially. Not only can you feel the pain of loss financially but, more important, you can chip away at your internal state of confidence and create frustration by not getting filled.

You should be more concerned about avoiding big losses and less concerned about taking small losses. If you can?t bear to take a small loss, you will never give yourself an opportunity to be around when a big winning idea comes along, as every trade you enter has the risk of first turning against you for a loss. You must execute by knowing what your risk is in each trade, and define parameters to make sure you can ride favorable trends correctly as well so that your winners will be larger than you losers. And never get stuck in the mindset of hoping a loser will come back to "breakeven," as that is one of the trader's most deadly mental fantasies. Billions of dollars have been lost by technology investors hoping their stocks would bounce back in recent years to allow them to escape the downtrend. That only led to even greater losses in most cases. That's how a short-term trader can become a long-term investor unintentionally, and that is a position in which you never want to put yourself.

Ask how well you trust yourself to execute your trading plan. You want to judge your effectiveness based on how well you get in and out of the market when your method gives entry and exit signals. You?ll need to be decisive, not hesitant, know in your heart that your method is well tested and that your risk is low compared to your likely reward. In other words, you must be fully prepared before you go into the heat of battle during a trading day. You need to know where you will enter and where you will exit if you are a discretionary trader. Or you need to know what system you are following and be prepared to enter and exit as the system dictates. This keeps you disciplined and focused on following a process that can generate favorable results over time.

2. Fear of Missing Out
Being a Part of the Crowd Isn?t
Everything It's Cracked Up to Be

Every trend always has its doubters, but I often notice that many skeptics of a trend will slowly become converts due to the fear of missing out on profits or the pain of losses in betting against that trend. The fear of missing out can also be characterized as greed of a sorts, for an investor is not acting based on some desire to own the security - other than the fact that it is going up without him on board. This fear is often fueled during runaway booms like the technology bubble of the late-1990s, as investors heard their friends talking about newfound riches. The fear of missing out came into play for those who wanted to experience the same type of euphoria.

When you think about it, this is a very dangerous situation, as at this stage investors tend essentially to say, "Get me in at any price - I must participate in this hot trend!? The effect of the fear of missing out is a blindness to any potential downside risk, as it seems clear to the investor that there can only be gains ahead from such a "promising" and "obviously beneficial" trend. But there's nothing obvious about it.

We remember the stories of the Internet and how it would revolutionize the way business was done. While the Internet has indeed had a significant impact on our lives, the hype and frenzy for these stocks ramped up supply of every possible technology stock that could be brought public and created a situation where the incredibly high expectations could not possibly be met in reality. It is expectation gaps like this that often create serious risks for those who have piled into a trend late, once it has been widely broadcast in the media to all investors.

3. Fear of Letting a Profit Turn into a Loss

I get many more questions from subscribers asking if it is time to take a profit than I do subscribers asking when they should take their loss. This represents the fact that most traders do the opposite of the "let profits run, cut losses short" motto: they instead like to take quick profits while letting losers get out of control. Why would a trader do this? Too many traders tend to equate their net worth with their self-worth. They want to lock in a quick profit to guarantee that they feel like a winner.

How should you take profits? Should you utilize a fixed target profit objective, or should you only trail your stop on a winning trade until the trend breaks?

Those who can accept more risk should consider trailing a stop on their trending position, while more conservative traders may be more comfortable taking profits at their target objective. There is another alternative as well, which is to merge the two concepts by taking some profits off the table while seeking to ride the trend with a trailing stop on the remaining portion of the position.

When I trade options, I usually recommend taking half of the position off at a double or more, and then following the half position still open with a trailing stop. This allows you to have the opportunity to ride my best trading ideas further, as these are the trades where I am mostly likely to continue being right. Yet, I am also able to get the initial capital at risk back in my pocket, which frees me from worrying about letting a profit turn into a loss; I am guaranteed a breakeven even if the other half position were to go to nothing overnight. My general rule for the remaining half position is to exit if it reaches my trailing stop of half its maximum profit on an end-of-day closing basis, or scale out of the remaining half position every time it doubles again.

I?m also a big fan of moving your stop up to breakeven relatively quickly once the position starts to move in your favor, by about five percent on a stock or by roughly 25 percent on the option. It is also critical to recognize the impact of time spent waiting for a position to move. If you are not losing but not yet winning after several trading days, there are likely better opportunities elsewhere. This is known as a "time stop," and it will get your capital out of non-performers and free it up for fresher trading ideas.

4. Fear of Not Being Right - All Too Common

Too many traders care too much about being proven right in their analysis on each trade, as opposed to looking at trading as a probability game in which they will be both right and wrong on individual trades. In other words, their overall method will create positive results.

The desire to focus on being right instead of making money is a function of the individual's ego, and to be successful you must trade without ego at all costs. Ego leads to equating the trader?s net worth with his self-worth, which results in the desire to take winners too quickly and sit on losers in often-misguided hopes of exiting at a breakeven.

Trading results are often a mirror for where you are in your life. If you feel any sort of conflict internally with making money or feel the need to be perfect in everything you do, you will experience cognitive dissonance as you trade. This means that your brain will be insisting that you cannot exit a trade at a loss because it ruins your self-image of perfection. Or if you grew up and feel guilty about having money, your mind and ego will find a way to give up gains and take losses in the markets. The ego?s need to protect its version of the self must be let go in order to rid ourselves of the potential for self-sabotage.

If you have a perfectionist mentality when trading, you are really setting yourself up for failure, because it is a given that you will experience losses along the way in trading. Again, you have to think of trading as a probability game. You can't be a perfectionist and expect to be a great trader. If you cannot take a loss when it is small because of the need to be perfect, then the loss will often times grow to a much larger loss, causing further pain for the perfectionist. The objective should be excellence in trading, not perfection.

In addition, you should strive for excellence over a sustained period, as opposed to judging that each trade must be excellent. The great traders make mistakes too, but they are able to keep the impact of those mistakes small, while really riding their best ideas fully.

For the trader who is dealing with excessive ego challenges (yet, who wants to admit it?), this is one of the strongest arguments for mechanical systems, as you grade yourself not on whether your trade analysis was right or wrong. Instead you judge yourself based on how effectively you executed your system?s entry and exit signals. This is much easier for those traders who want to leave their egos at the door when they start to trade. Additionally, because we are raised in a highly competitive culture, the perception of a contest or competition will also bring out your ego's desire to win and beat others.

You will be better off seeing trading as a series of opportunities that will become apparent to you, and your task is to create a plan that finds opportunities with potential rewards that are several times greater than the risks you incur.

Be sure you are writing down your reasons for entering each trade, as the ego will play tricks and come up with new reasons to hang on to losing positions once the original reasons have evaporated. One of our survival mechanisms is remembering the good and omitting the bad in our minds, but this is dangerous in trading. You must acknowledge the risk and use a stop on every trade to admit when the analysis is no longer timely. This helps prevent undesirable situations where you get stuck in a position because you did not adhere to your original stop. This is a bad use of capital being tied up in an under-performing position, when there are likely to be many better opportunities elsewhere. Trading without stops is an ego-driven approach that hopes to avoid accountability for a losing trading idea. This is an unacceptable behavior to the successful trader, who knows he must limit risk with stops to stay in the game for the next trading opportunity.

In summary, your trading plan must account for the emotions you will be prone to experience, particularly those related to managing fear. As a trade, you must move from a fearful mindset to mental state of confidence. You have to believe in your ability as well as the effectiveness of your plan to take profits that are larger than the manageable losses. This builds the confidence of knowing that you are on the right track. It also makes it easier to continue to execute new trades after a string of losing positions. Psychologically, that's the critical point where many individuals will pull the plug, because they are too reactive to emotions as opposed to the longer-term mechanics of their plan. If you?re not sure if you can make this leap, know that you can if you start small.

Too many investors have an "all-or-none" mentality. They're either going to get rich quick or blow out trying. You want to take the opposite mentality - one that signals that you are in this for the longer haul. This gives you "permission" to slowly get comfortable and to keep refining your plan as you go. As you focus on execution while managing fear, you realize that giving up is the only way you can truly lose. You will win as you conquer the four major fears, to gain confidence in your trading method and, ultimately, you will gain even more confidence in yourself.


Original post: http://www.trade2win.com/boards/psychology/45686-trading-psychology.html

Friday, November 26, 2010

Trade Setup: AEV - Status: Closed

Here is the 1-year daily chart of AEV:


It has been hugging the top of its trading channel for the past few weeks indicating overbought levels. It also tried to break out but it failed twice.

My entry and exit are shown in the chart.

My original exit was at point 2. However, I had trouble contacting my broker to sell them(specially last Nov 22), so my exit was extended up to this point.

I was concerned about its:

1. Bearish divergence on its MACD visible on the daily chart(point 1 and 2 on price and MACD); and

2. Bearish divergence on its histogram suggesting weakening upward momentum.

3. Too much price spread during trading. I have a relatively holding a small amount of shares but I couldn't sell them @market without driving the price down by around 3% or so!

However, point 3 on ROC suggests a "buy" on rebound but I am not willing to bet on it.

It could also be moving in a "box" but I'm not patient enough to sit and wait for the boxes to move:


Comparing it with my previous position in DMC(1 month):


The trade did fairly well, profiting from both positions.


Conclusion: Sold with 7.53% profit, around 50% off my highest gain in this position.
Good entry. Late exit.

On the red corner...

The market continued to drop today, losing another 43.91 points, 1.07% lower from yesterday at 4053.38, 53 points away from the psychological support at 4000.

The weekly chart suggests that the index is now forming a bottom. Hopefully, the psychological supports hold and a bounce from there would suggest the resumption of the uptrend.

Gainers came mostly from the third liners with the exemption of PCOR +12.21% while losers are mixed with first and second liners with volume: MER, JFC, AT, and MPI.

AP declined to a low of 31.60 today before recovering at the closing at 32.95, closing lower from yesterday by 2.37%. That was one quick drop. Its volume today is unusually high. The last time it had volume traded like this was May 11 this year.
Recovery is possible by next week.

Sold AEV today at 37.70. It could rebound by next week by I highly doubt that it would be making new high by then as it still appears weak on the weekly chart, as also being pointed out by the bearish divergence in MACD on its daily chart.

AP is up by 21.73% within twenty-five trading days with doubled up position.
Sold AEV with 7.53% gain within fourteen trading days.

*Currently waiting to enter another position in another stock.

Thursday, November 25, 2010

The market opened strongly today but was unable to sustain it as selling pressure started by mid session, losing 27.05 points closing lower by 0.66% at 4097.49.

Top gainers with significant volume today are SLI, BEL, LC, and PCOR.. Top losers with significant volume are LPZ, URC, JGS, MER, DMC and NIKL.

AP declined by 0.59% today closing at 33.75. Technical indicators are pointing to further decline in the short term. Weekly chart is still showing relative weakness confirming the weakness in the daily chart.

AEV declined by 0.39% today closing at 38.35. Technical indicators are still pointing to further decline in the short term. However, it seems like it is near the bottom already. Weekly chart is also showing relative weakness.

Both issues might resume their advances late to mid next week.

Personal target: P35 - today's high is shy by .25 at 34.75
Personal target: P45

*I became overly bullish on the issues that I am currently holding because of my candlestick readings. However, candlesticks does seem unreliable and giving off fake readings so I am just going to use it to check price action and not for possible price behavior in the short term. I would be sticking with the other 2 technical indicators that I am using now for future price actions as they seem more consistent.

AP is up by 24.68% within twenty-four trading days with doubled up position.
AEV is up by 9.38% within thirteen trading days.

Lessons from successful traders - found over the internet

1. If you are bearish, do not be afraid to pay down.

Sell on signs of weakness. It takes guts to sell when price has already fallen considerably. The opposite applies for bullishness. Buy on signs of strength.

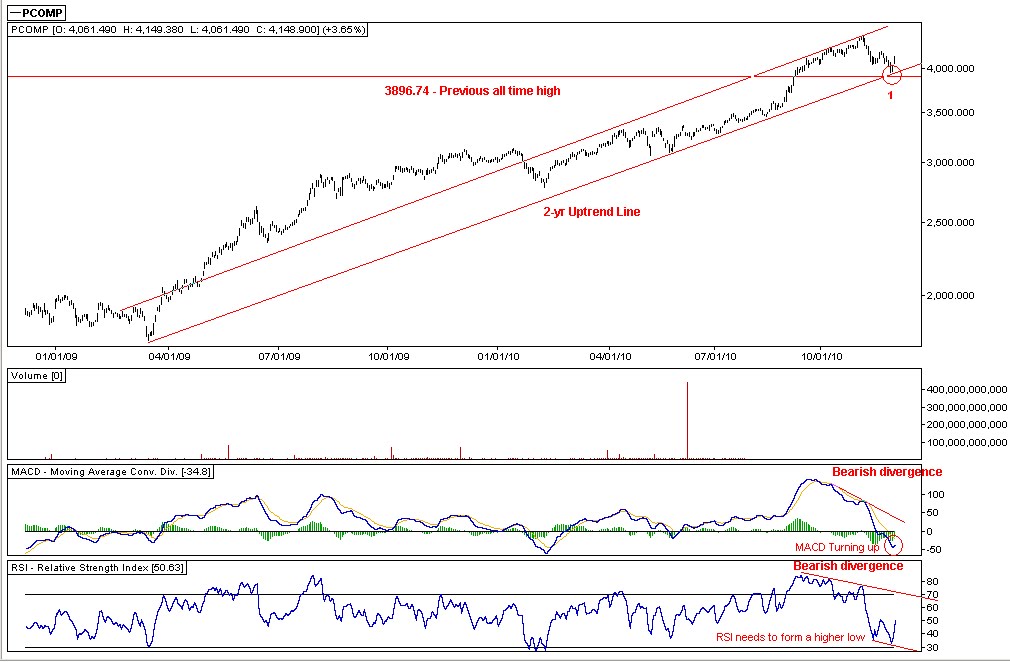
2. Double tops and bottoms can be very profitable opportunities

Sell at double tops and buy at double bottoms AS they form. These are potentially very profitable opportunities and you can trade them with tight stops.

3. Act on intuition

Intuition comes from studying the market and watching it over a long period of time. If you get a strong feeling about a market - even if you are not sure completely why - act on it. But know that feelings can be wrong and be quick to act if the market does not confirm your intuition.

4. There is no such thing as a price that is too high or a price that is too low.

The market is never too high or too low.

5. Have guts when a position goes onside

There is little point in calling a top or a bottom only to take a few points. You have to be able to hold a position.

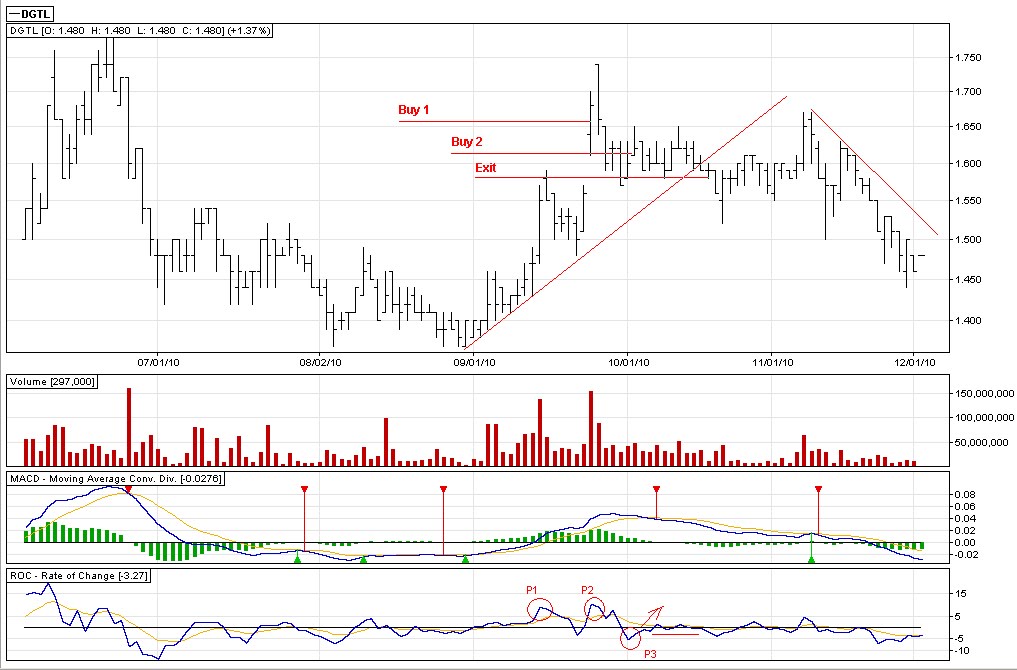
6. Fading moves can be very profitable but there is no room for stubborness

When a price is at extremes and you want to attempt to fade it, take small positions and be prepared to act quickly to cut your losses if price does not turn. Look for areas where the market last found it hard to get above/below. Look carefully at the price action. Is it stalling? Remember that there is no room for stubborness in the market.

7. Look for clues

The market almost always tips its hand to which way it is going. If you can't see this, you haven't watched it long enough.

8. Remember why you got in.

If you are position trading a market and you are, for example, buying a considerable distance above support, then that last support is the reason for entry. Until that is invalidated, your trade reason still stands. The "market" knows or cares nothing of where your break even point or fixed trailing stop is. These two latter terms, if based on monetary concerns (not wanting to lose, wanting to protect profits) rather than based on technicals (keeping a valid s/r level between you and the price) are useless.

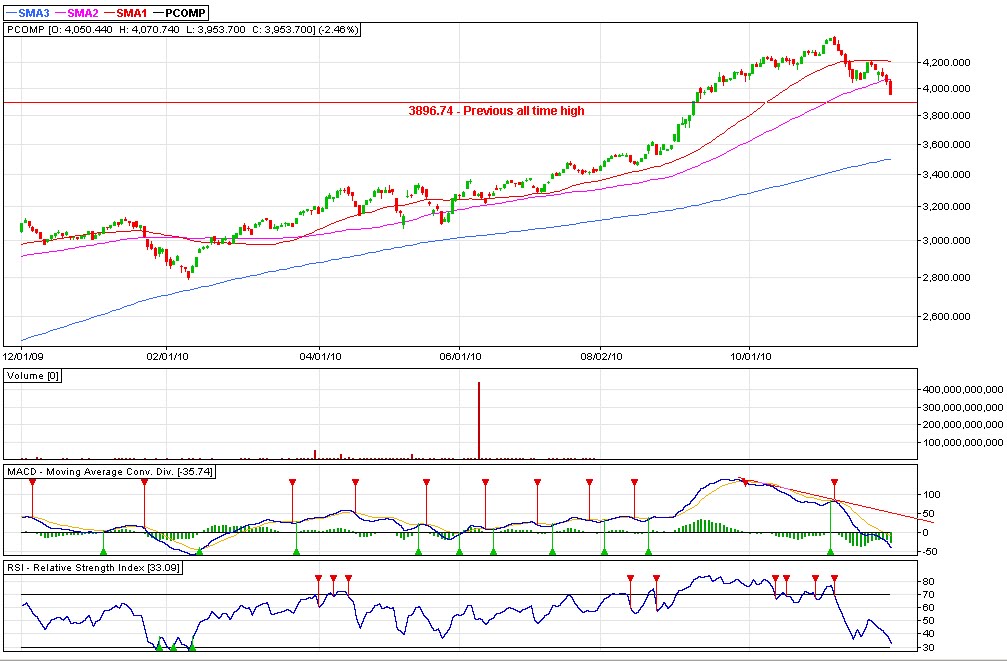
9. Support/Resistance is the key to the market

This is one of the only technicals that the professionals keep coming back too. Where are the support and resistance points? To determine their validity, watch the strength of the price at them.

10. See the bigger picture

You have to have the ability to see the bigger picture. Where are we on the higher timeframes? How much room do we have to move?

11. Get involved

Invariably, those that make big money, get involved. You need to live and breathe your market to make money consistently. Watch it as much as you can. Time spent watching is time spent learning.

12. Fundamentals

Fundamentals are useful but remember that how a market should react and how it does react are two very, very different things. Don't get married to a fundamental opinion if the price does not confirm it.

---------------------------

1. Read
2. Understand
3. ???
4. Profit!

Wednesday, November 24, 2010

Technical Analysis

Technical analysis is the only way to measure the emotional component of the market. We know that many times an ounce of emotion can be worth a pound of facts. How else to explain the sudden shift in the market without a change in the fundamentals?

-Steve Nison

Personal Disclosure

The market continued to slide today, losing as much as 84.86 points during the early today before recovering at the later part of the session, losing only 22.81 points at closing. The market closed at 4124.54, lower by 0.55% from yesterday.

The market is now hovering above the psychological support at 4000. A bounce a from there would suggest the resumption of the uptrend. If it breaks 4000, it should hold at the previous high of 3896 levels.

SMB finally took a breather today after going up for the past 9 days straight, reaching an all time high of 31.90 before heavy profit taking occurred, pushing the stock down to a low of 22.50 before recovering some points, losing only 7.58% at the closing at 25.

AP recovered and closed strongly today, opening lower at 32.45 before closing at 33.95. Rising method candlestick pattern(bullish) was completed today plus bullish engulfing would suggest further advance in the short term, probably up til early next week.

AEV also recovered today, closing strongly at 38.50. Latest candlestick formation and momentum/roc are suggesting advances in the short term. However, there is a bearish divergence seen on its MACD suggesting that the next upswings wouldn't be as strong as before. Anyway, better watch out for bearish confirmations before taking profits.

AP personal target: P35
AEV personal target: P45

AP is up by 25.42%% within twenty-three trading days with doubled up position.
AEV is up by 9.77% within twelve trading days.

Tuesday, November 23, 2010

Personal Disclosure

Profit taking extended today after rallying for two days early this weak, making the market lose 39.54 points, lower by 0.94% closing at 4147.35.

SMB had an unbelievable performance today as it closed 42.37% higher at 27.05, gaining an average of 178.87% within this month, reaching 100+ rsi at some point today. Nice parabolic spike for those who have. XD

SMC is showing relative strength this past week and it looks like it's forming a good trade setup.

AP declined by 1.64% today closing at 32.95. Indicators are suggesting further decline this week and late to early next week rebound.

AEV declined by 3.08% today closing at 37.80. Indicators are suggesting further decline this week and late to early next week rebound. Too bad I didn't get to sell yesterday.

AP is up by 21.73% within twenty-two trading days with doubled up position.
AEV is up by 8.16% within eleven trading days.

Monday, November 22, 2010

Nickel Asia (NIKL) and some lazy updates

The market opened the week lower by 16.71 points closing at 4186.89. The weekly chart is looking relatively weak while the daily chart is relatively toppish as of the moment, suggesting further sideways movement with downward bias.

NIKL was listed today in the PSE showed relative strength on the opening, managing a high of 19.40 before closing at 16.50 caused by profit taking. Can't blame them for taking it, more or less 29% gain a day is very hard to ignore.
NIKL IPO is priced at the lower end of its range at P15.

NIKL Intraday Chart:


Breaking above 17 could possibly reverse its intraday trend. However it could also meet immediate resistance at 18.20 levels.

I was trying to lock my profits in AEV today but all of my broker's line were busy 10:30 am onwards.

Anyway, one of my other technical indicators that I am still testing seems to be reliable when to take profits. I will test it further - and back test it later.

AP is up by 23.76% within twenty-one trading days with doubled up position.
AEV is up by 11.24% within ten trading days.

Sunday, November 21, 2010

Price is War

A market making new highs is rising, Buyers are winning

A market making new lows is falling, Sellers are winning

When is the war on? When are the troops sleeping?

Price is territory that Buyers and Sellers are at War for.

What would be a probable and realistic price goal for the Buyers to achieve if they won the battle today?

What would be a probable and realistic price goal for the Seller's to achieve if they won the battle today?

You will choose a side to be on, you will watch to see who early on is winning the battle, and make your choice, you will know where your choice would be proved wrong, you will expect to take the earliest profit that justifies your risk in relation to the overall goal of the team you have chosen.

If your team is really kicking the other's ass, you might go for a larger portion of their probable win for the day.

If you were wrong, you were wrong, you will fight another day.

You will not become Happy when you win, you will not become Angry when you lose.

You will be right slightly more than you are wrong, and you will judge your risk and reward based upon this fact.

You will gain slow and steady equity.

Friday, November 19, 2010

Quick Update!

The market rebounded nicely today, gaining 2.01% closing at 4203.60. MACD is crossing back over the zero line and rate of change is still pointing up suggesting further advances in the short term. The index also closed above its 10SMA confirming the advance.

My positions in AP and AEV continued to perform very well in today's session, AP gaining another 5.33% today closing at 33.60. It opened higher today, forming a gap that is pointing to 36.60 as a target on the next advance. However, momentum is relatively at peak now while rate of change has started to decline suggesting an incoming correction in the short term. Look for possible entries near 31.90 to 32.80 levels.

AEV gained 4.44% closing at 40 today. Rate of change and momentum are both toppish suggesting a correction in the short term.

Personal target for AP is 35. Current price is shy by P1.40 from target.
Personal target for AEV is 45. Current price is shy by P5 from target.

AP is up by 24.13%% within twenty trading days with doubled up position.
AEV is up by 14.09% within nine trading days.

Thursday, November 18, 2010

Trade Setup: AEV - Status: Open

Here is the most recent trade that I did:

DMC


Sold it at 39.40 because:

1. Declining volume during advances;
2. Bearish divergence on ROC; and
3. It was showing relative weakness through the entire session that day before getting pushed up at the closing which also happened the next day;

4. Found a trade setup in AEV (plus earnings report factor):


which I believe I was right as it immediately showed profits the next day despite of the strong selling pressure. I am expecting it to advance strongly once the selling stops(possibly up until mid week).

Took a position at 34.10.

Up to date comparison between the two stocks:

Random observation

Our favorite gurus in our favorite trading sites are not posting any updates on their recent trades. It's almost two weeks now since their on their track record.

What could have happened to them this past week?